Bōde’s Chief Economist, Alan Kelly uses these metrics as the best indicators of the health of the real estate market to analyze both Calgary & Edmonton’s current market. Here’s an overview of his findings. Do your own analysis for your community with our recently updated Market Data dashboard that includes more up to date data and functionality! Let us know what you think!
To understand what’s happening in the real estate market you have to look at supply and demand.
The best proxies for supply and demand are:
Supply
New supply: New Listings (i.e. the number of homes recently listed for sale)
Total supply: Inventory (i.e. the total number of homes listed for sale)
Demand
Sales (i.e. the number of homes recently sold)
Supply & Demand
Months of Supply (i.e. the number of months it would take to sell all current inventory at the current rate of sale)
These metrics are the best indicators of the health of the real estate market. Let’s look at what they show us.
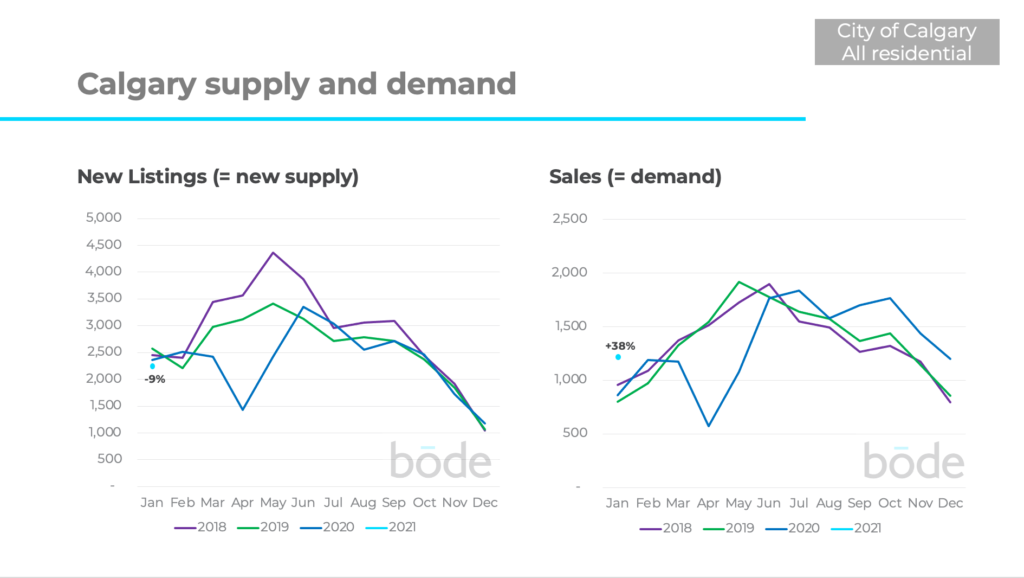
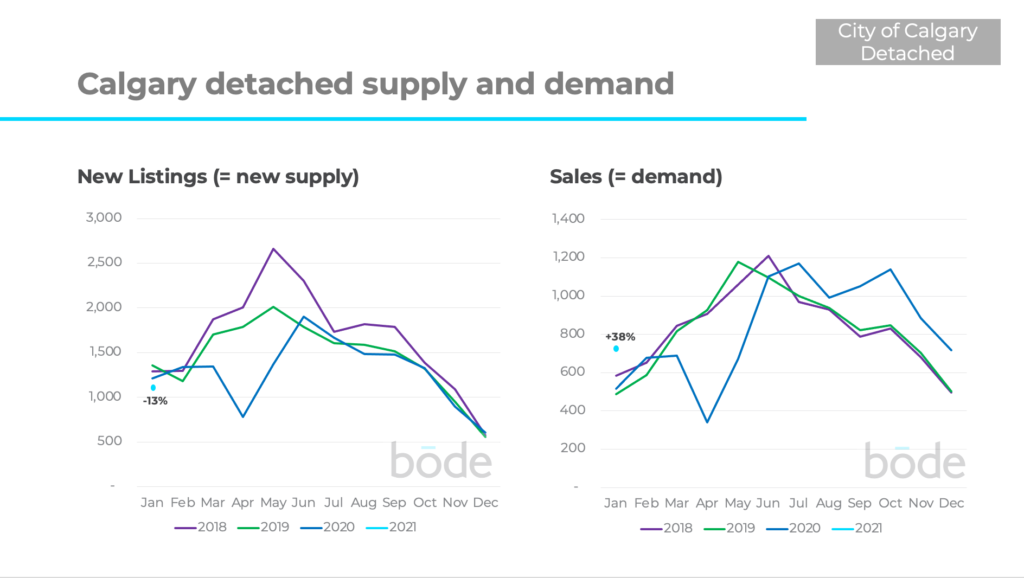
Calgary continues to see demand outpace new supply in the aftermath of the COVID-19 outbreak.
New listings in January were down 9% while sales were up a whopping 38% vs. the previous 3 years. Sales continued the strong trend they’ve been on since July 2020. We expect sales to continue to stay higher than usual for February and March 2021.
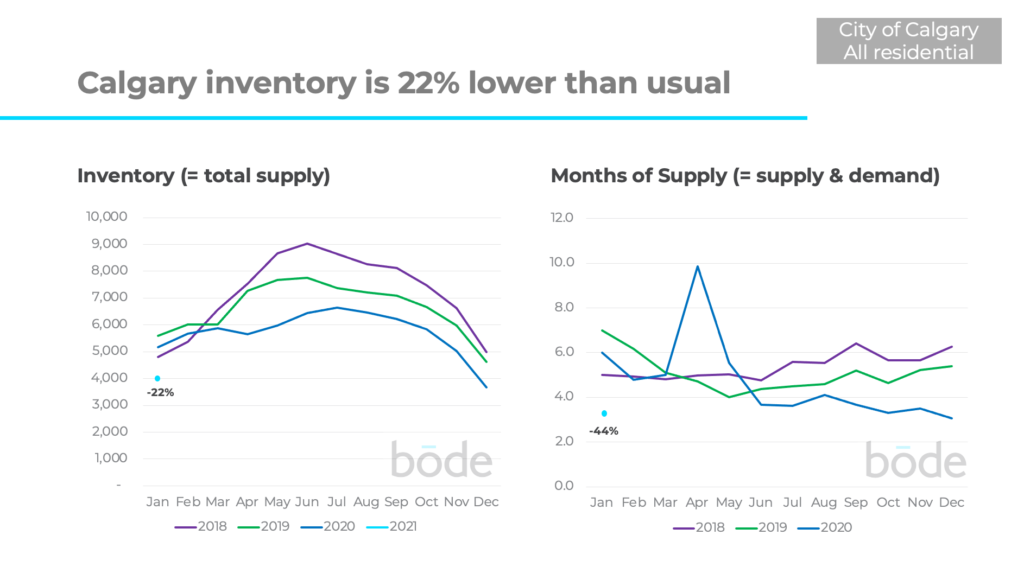
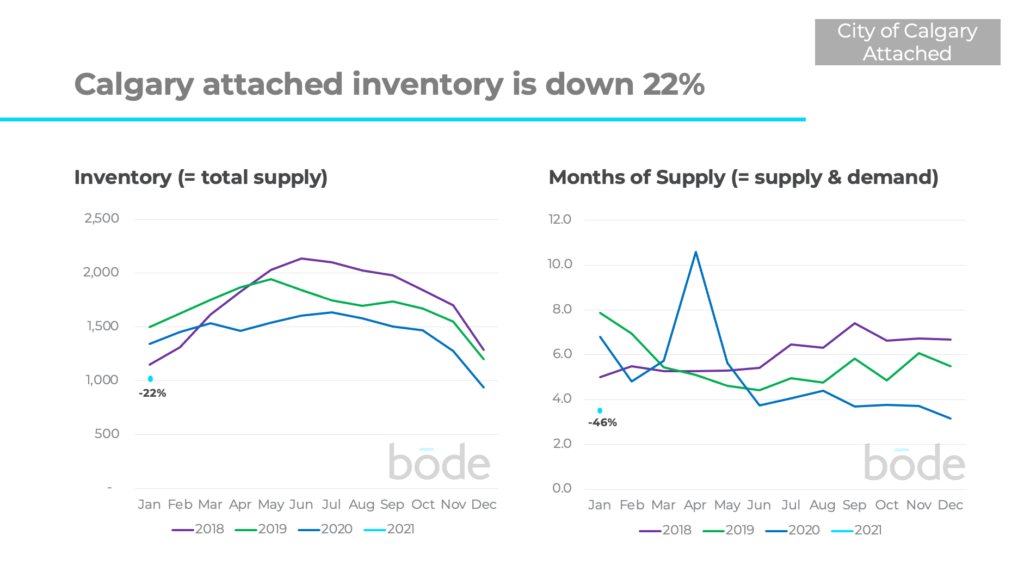
As a result of sales outpacing the number of new listings, the total number of homes for sale is down 22% compared to the average of the previous 3 years.
The combination of less supply and more demand has sent ‘months of supply’ even lower to just 3.3 months which is down 44% vs the previous 3 years.
Fewer months of supply generally makes conditions more favourable for sellers, while higher months of supply is more favourable for buyers.
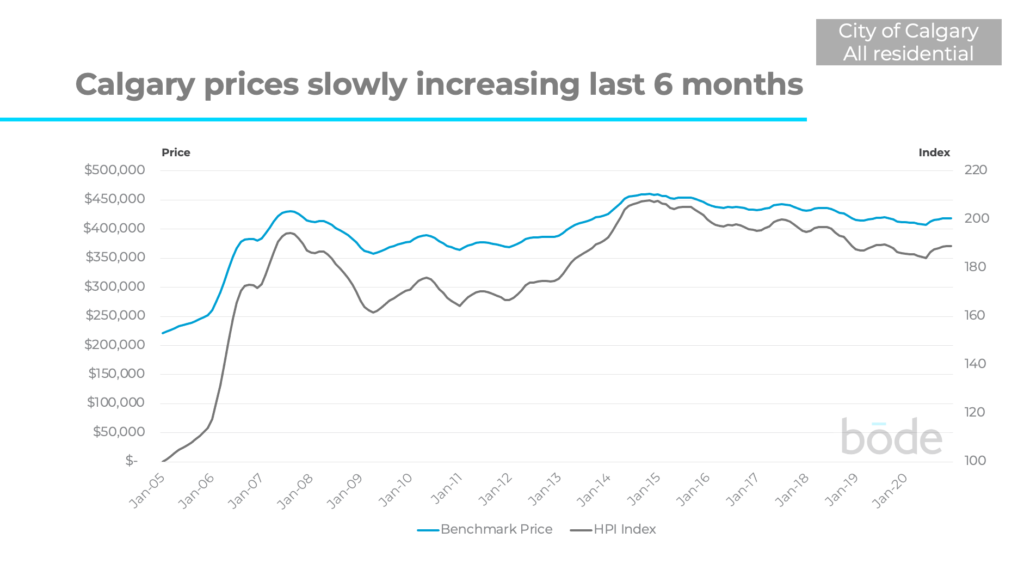
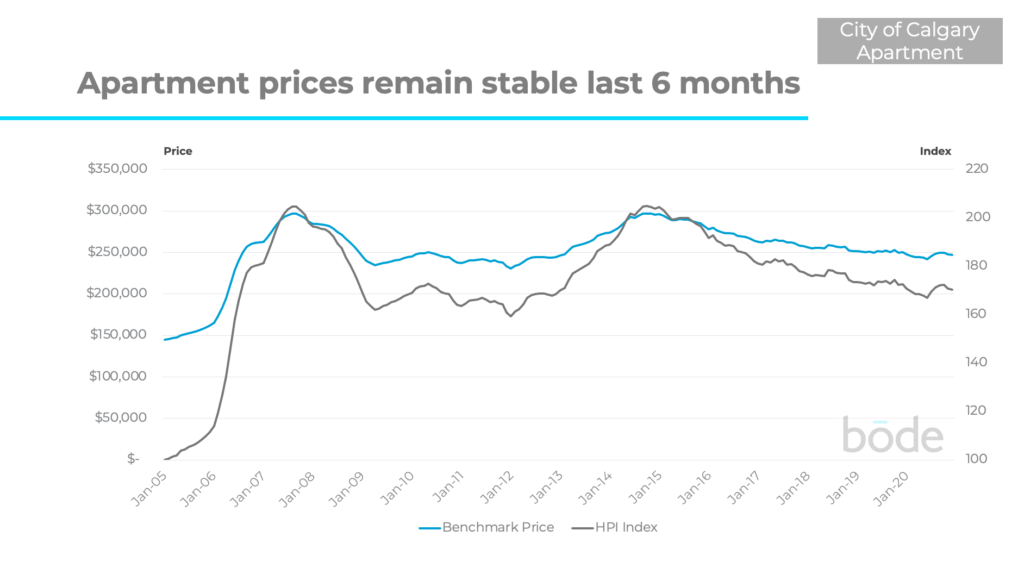
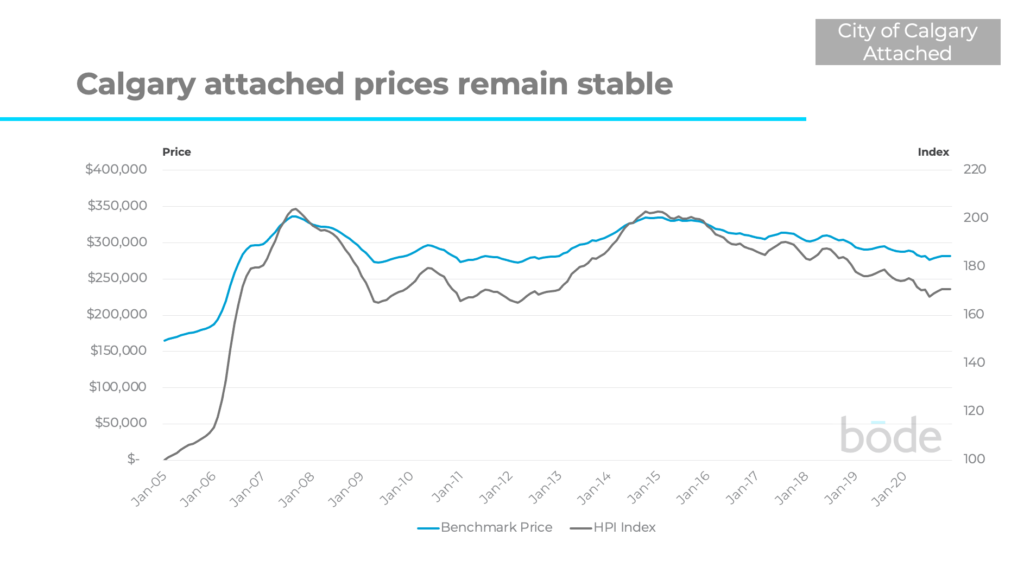
Overall, Calgary prices have been slowly increasing over the last 6 months.
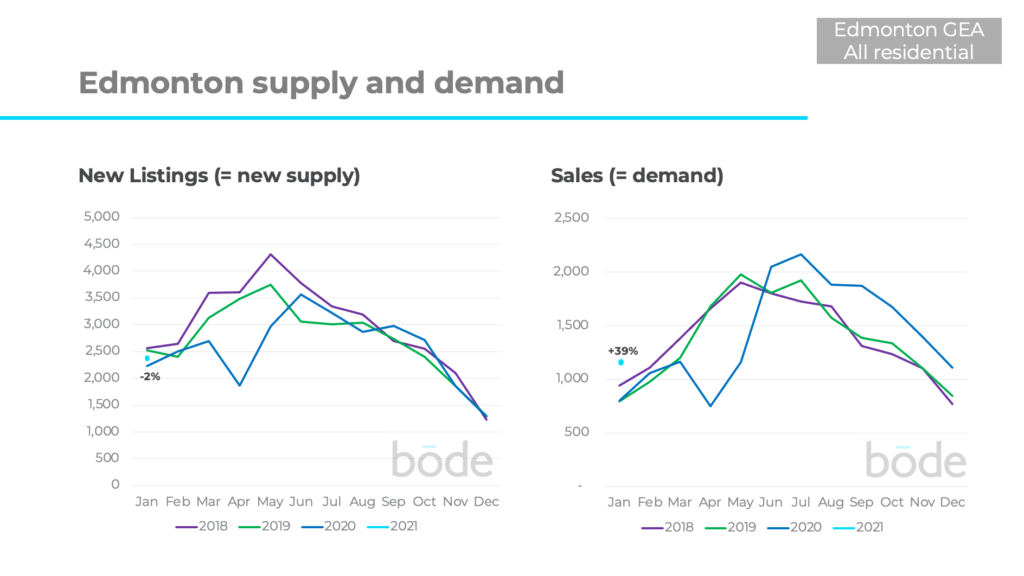
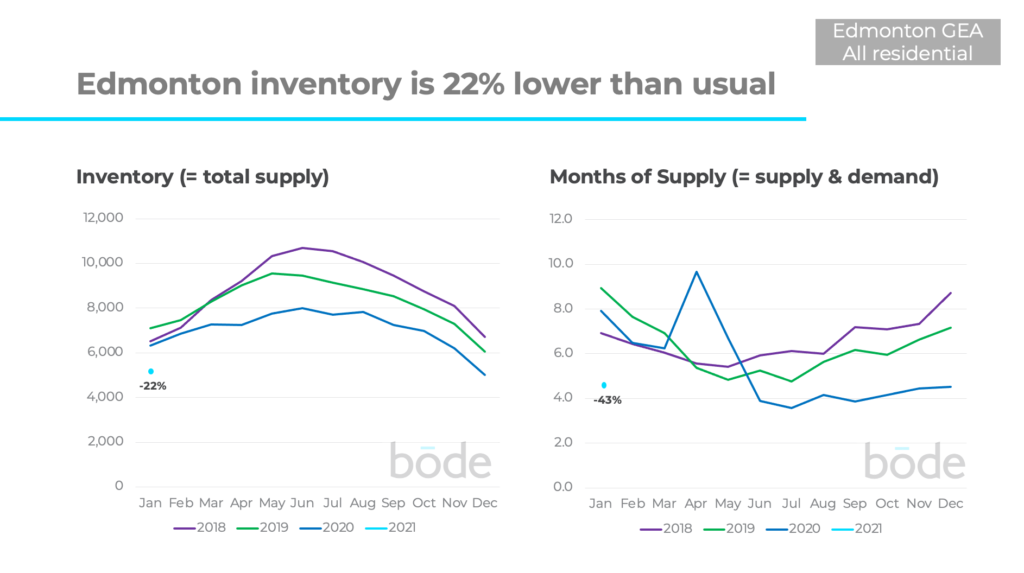
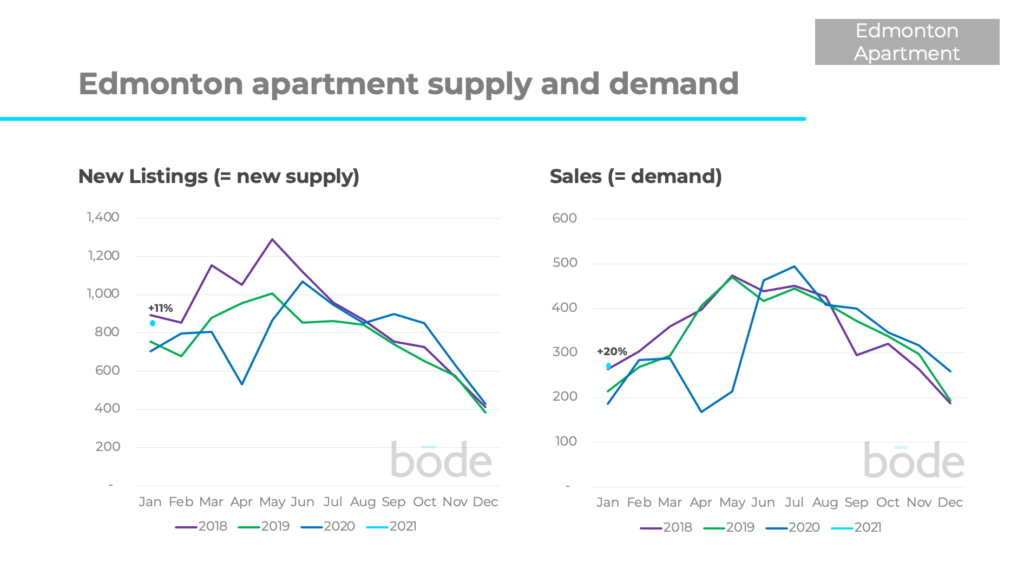
The overall picture is similar in Edmonton, where total supply is down 22% while sales continue to be strong, up 39% from previous years.
This is the 7th consecutive month of exceptionally strong demand in Edmonton.
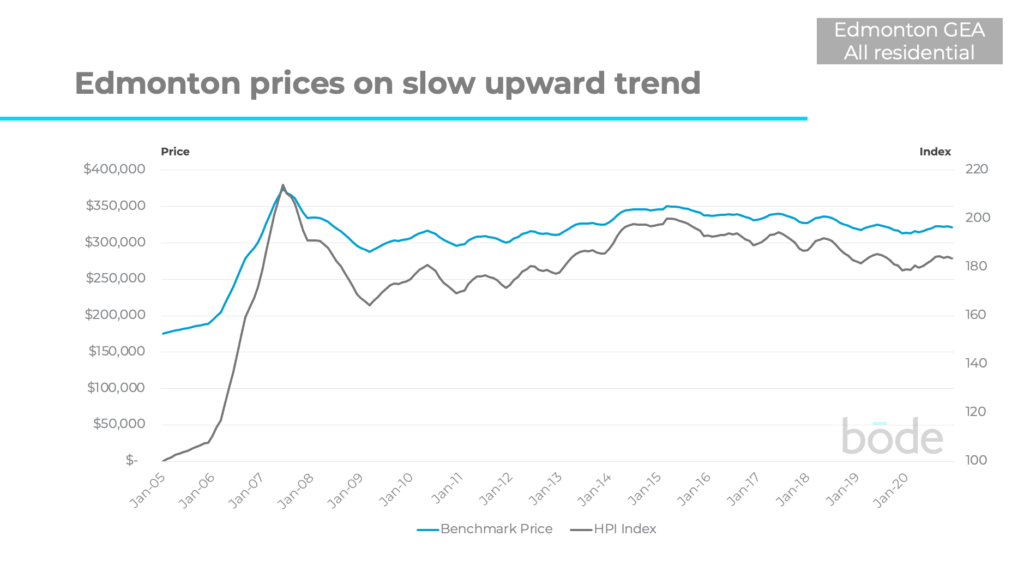
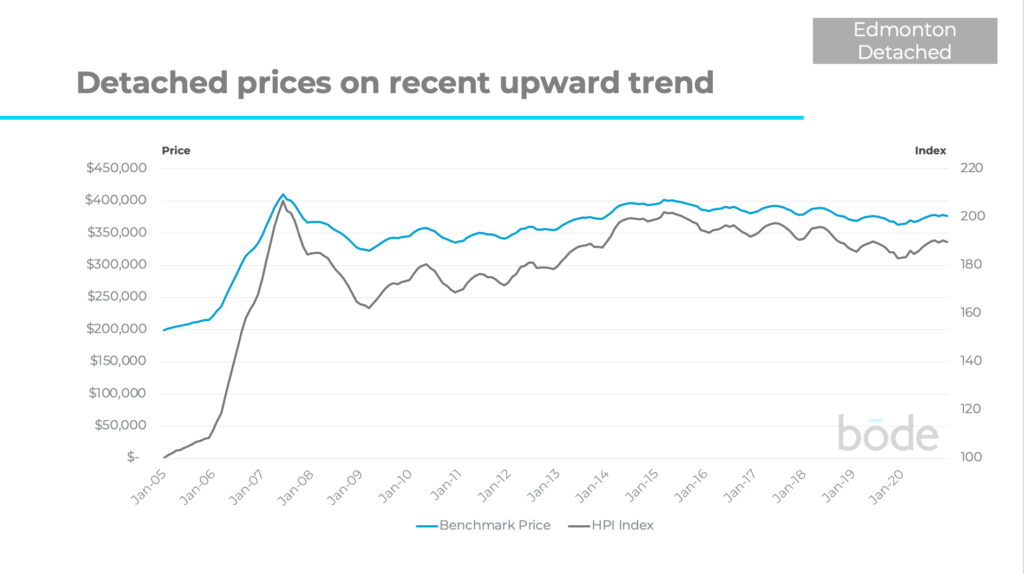
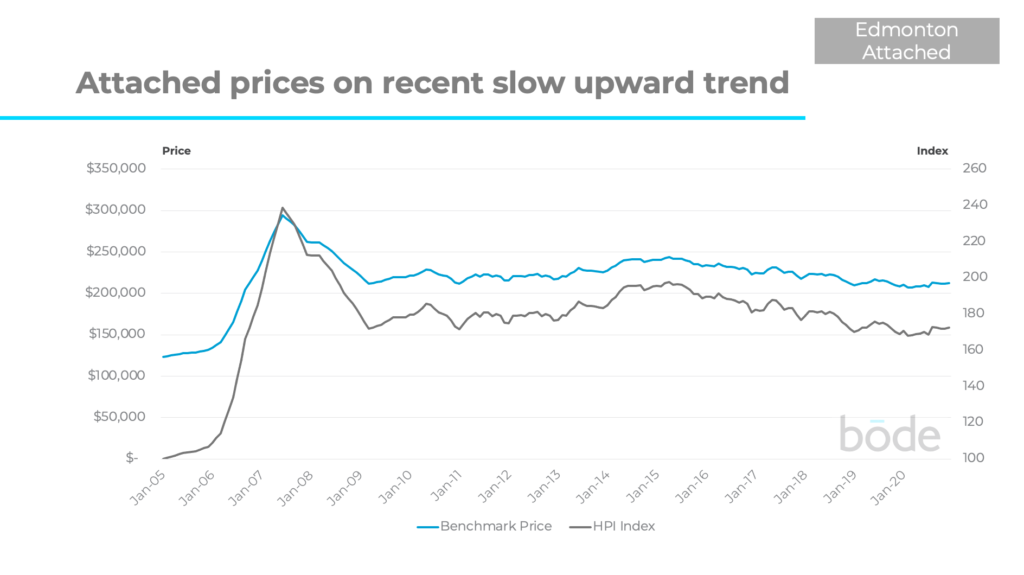
Edmonton prices have been on a very slow upward trend for the past 12 months.
What does this mean for sellers?
Right now supply is low relative to previous years, and demand is high which means it is a good time to sell your home. Sellers who price their home well have a good chance of selling quickly. However, your specific property value will be determined by market forces both within your community and against similar active listings. To find out what supply and demand look like for your specific community, click here.
What does this mean for buyers?
In Calgary and Edmonton, there are currently fewer options than there have been in previous years. This means active buyers need to move faster to beat other buyers to the available listings. One way you can move faster is by booking viewings directly through Bōde, so you don’t have to wait for a realtor to schedule your viewings.
Market conditions vary substantially by property type, community and price range
Above, we’ve looked at the overall markets for Calgary and Edmonton, but different segments are performing very differently. Let’s look at a few examples.
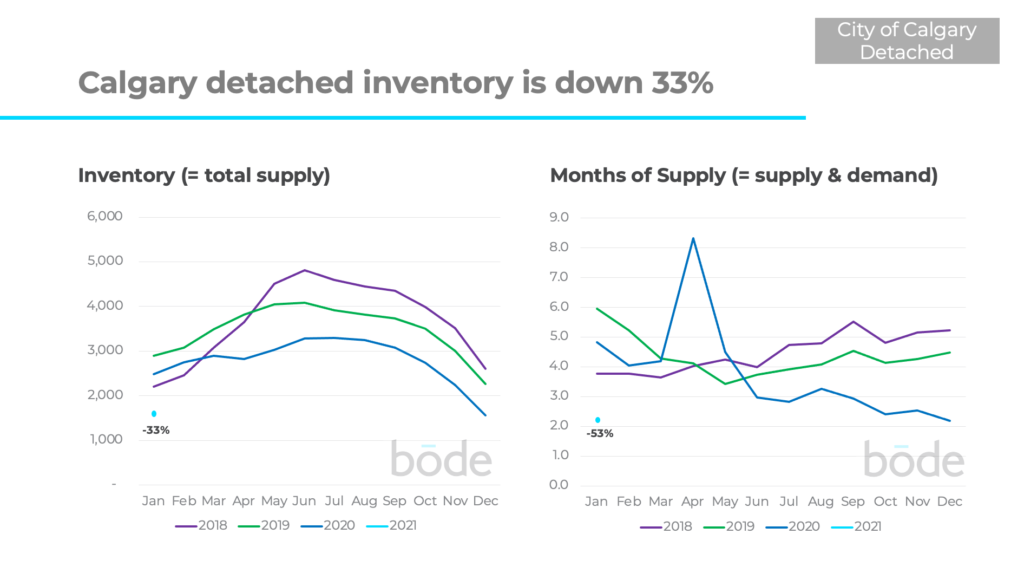
In January, sales of detached homes were up 38% vs the previous years. As a result, overall supply of detached homes is down 33% compared to previous years.
This has led months of supply to be down 53% to just 2.3 months, which means it’s one of the best times in recent years to be selling a detached home, and one of the toughest time to be buying as there’s considerably less inventory than normal to choose from.
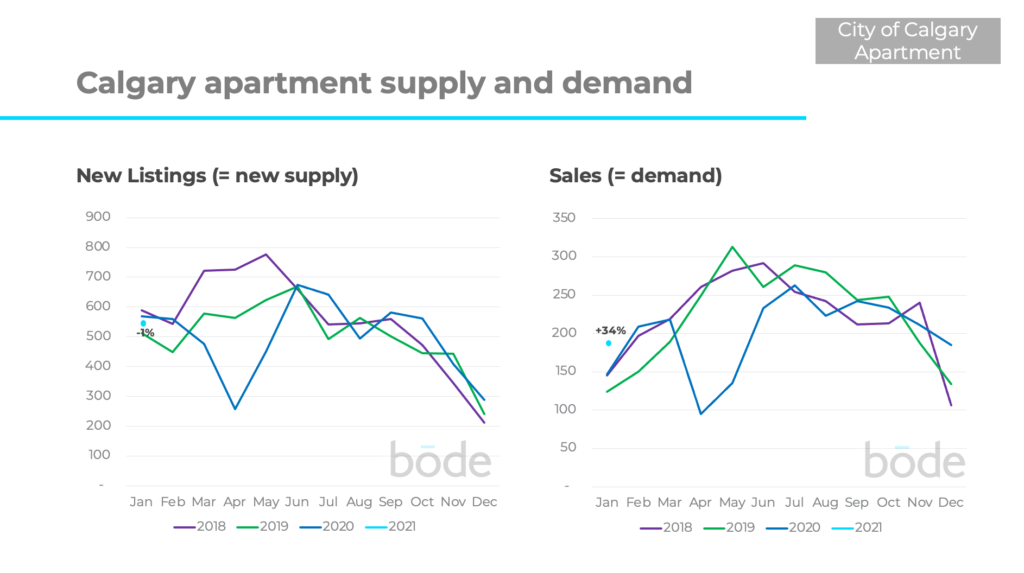
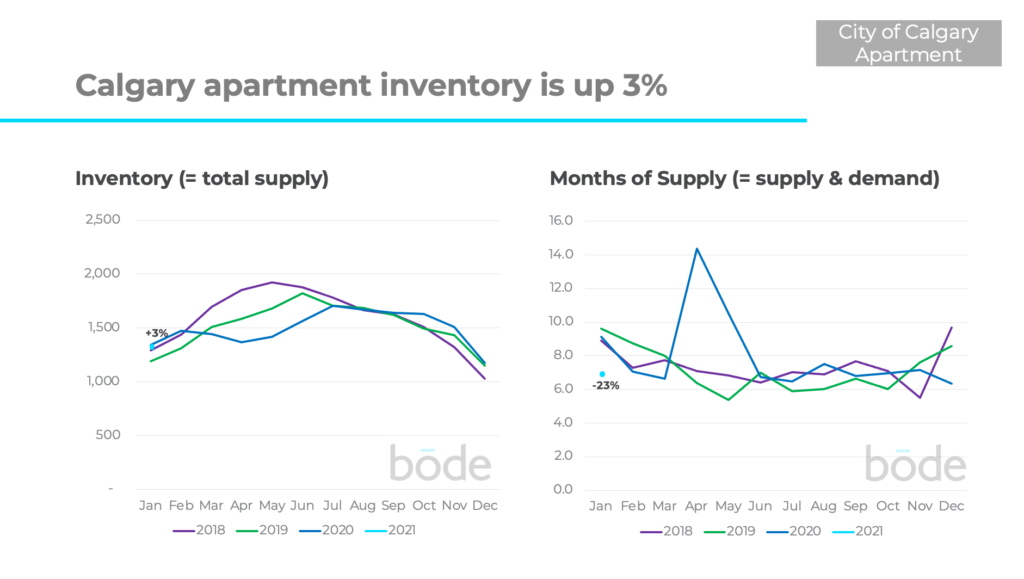
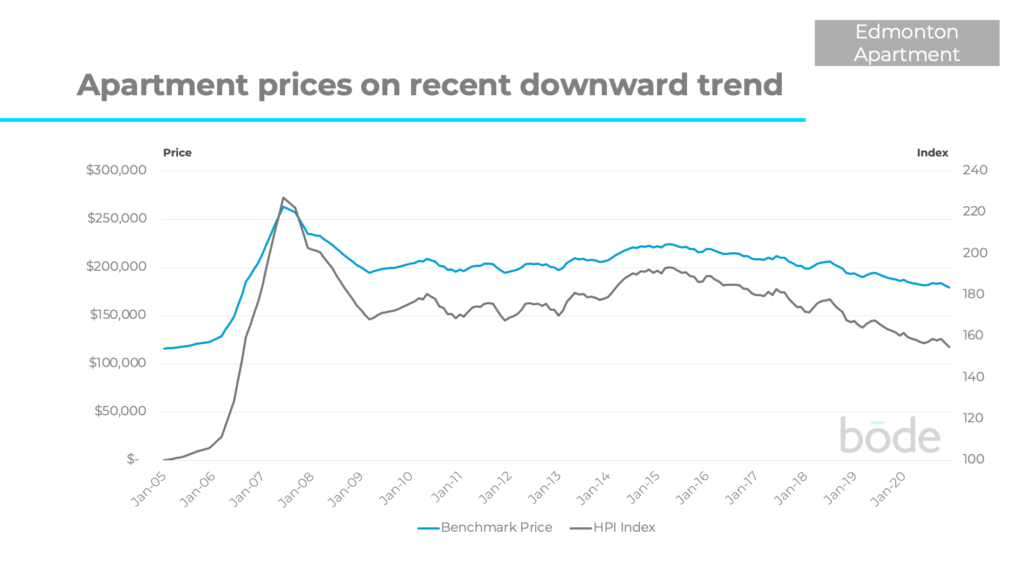
On the other end of the spectrum, there is currently 7.1 months of supply of apartments in Calgary – making it a buyers market.
New listings of apartments were down 1% in January, while sales were stronger than usual for January (up 34%). Despite 2 good months of sales, most of 2020 saw more new listings than sales, so overall inventory of apartments is up 3% vs previous years.
Buyers have a lot of apartment options which makes it more difficult for sellers to achieve the price (and speed of sale) they might have wanted.
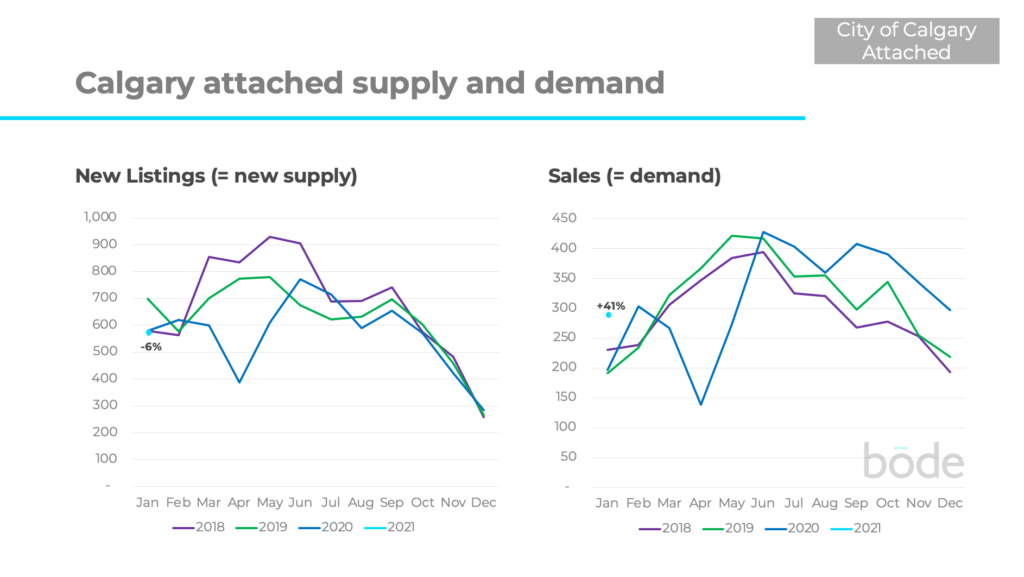
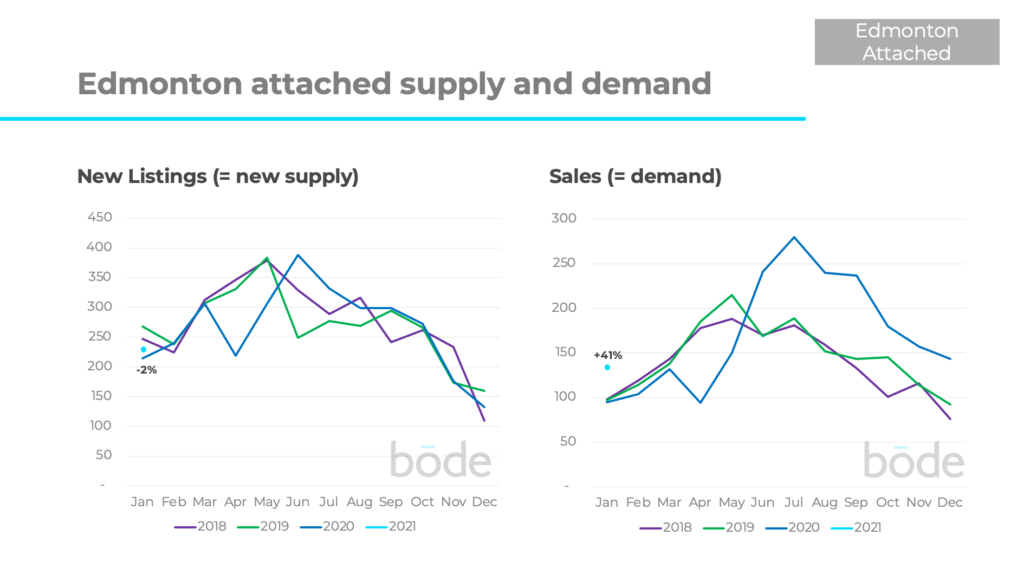
Attached homes (i.e. semi-detached or row homes) saw 6% fewer listings in January vs previous years. Sales remained strong at +41% compared to the last 3 years.
This caused total inventory to fall (-22% vs previous 3 years) and months of supply to drop to 3.6 months.
In general, you’re in a much better position if you’re selling a detached or attached home right now compared to an apartment, due to less supply and greater demand.
However, even this analysis is still too high level to understand what’s happening in your specific local property market. There are some communities of the city and some price bands where detached homes are performing better/worse, and the same goes for apartments.
It’s critical to understand the dynamics in your local property market
To understand your local property market, you need to look at your local data. Head over to Bōde’sMarket Data dashboard, the only place where you can see all the data yourself, including being able to filter on community, property type, and price range to see exactly what’s happening where you live. We’ve recently updated our Market Data dashboard with more up to date data and functionality! Let us know what you think!