Home buyers continue to purchase in Calgary – due to the strong economy as well as an increase in migration. The strongest market in Canada continues to see significant demand primarily in apartments in attached homes.
We help provide home buyers and sellers with the data they need to be successful. When you have access to accurate and relevant data, you can be more confident in setting the price of your home and selling it or buying at the right price.
With many important factors to consider (what kind of home you have, what community etc.), it’s important to look specifically at what the housing market is doing in your neighbourhood.
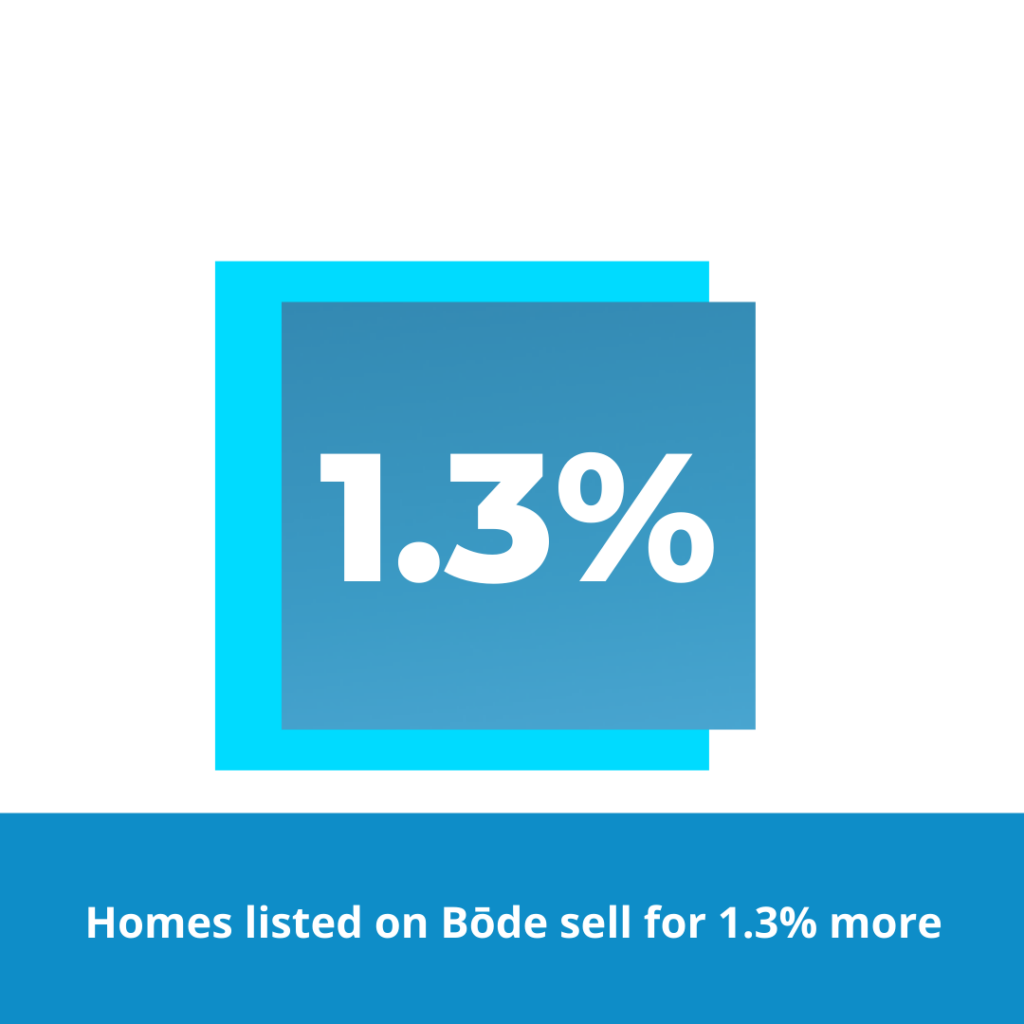
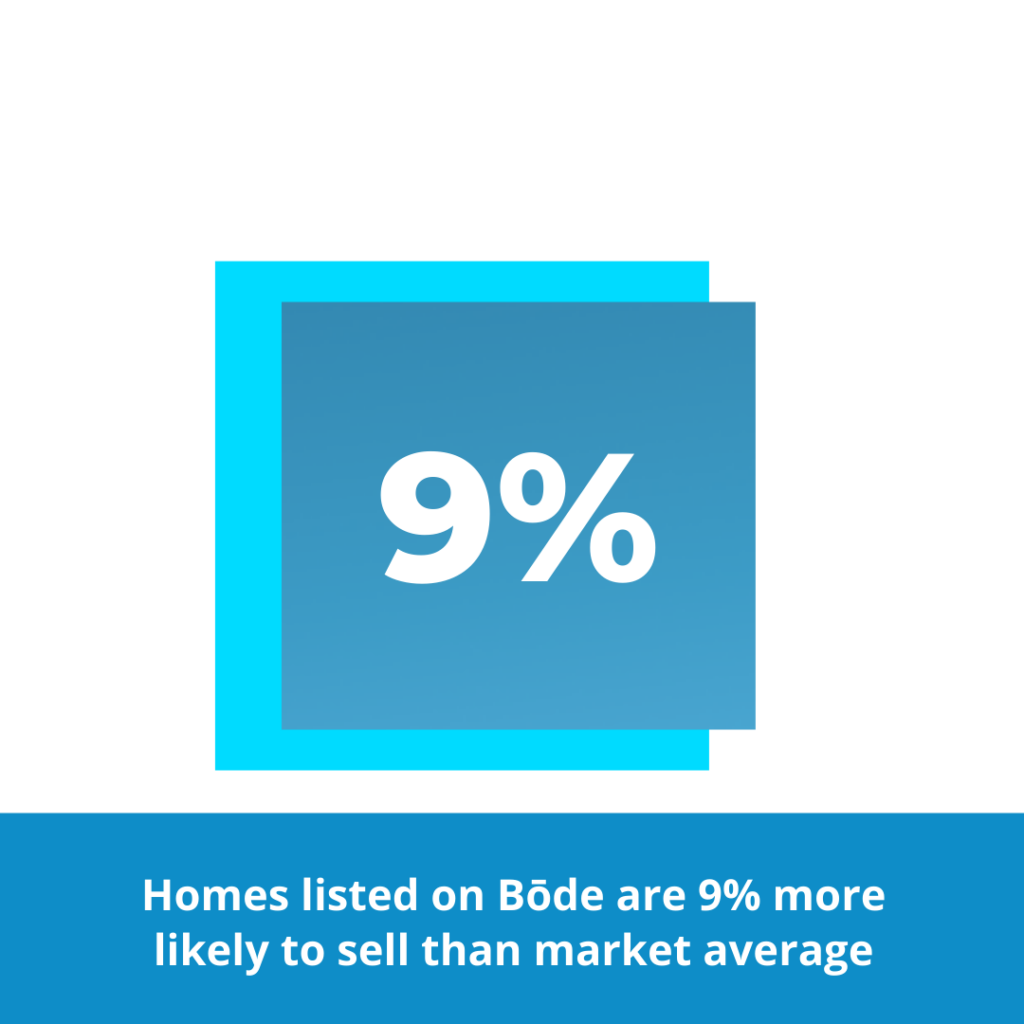
Bōde sellers are more successful and actually make more money, on average, than the rest of the market. We are also here to make sure you have the information you need to make the decisions that are right for YOU!
So what's happening in the Calgary real estate market as of June 2024?
Let’s start with a Macroeconomics view
To understand what’s happening in the real estate market you have to look at supply and demand.
The best proxies for supply and demand are:
Supply
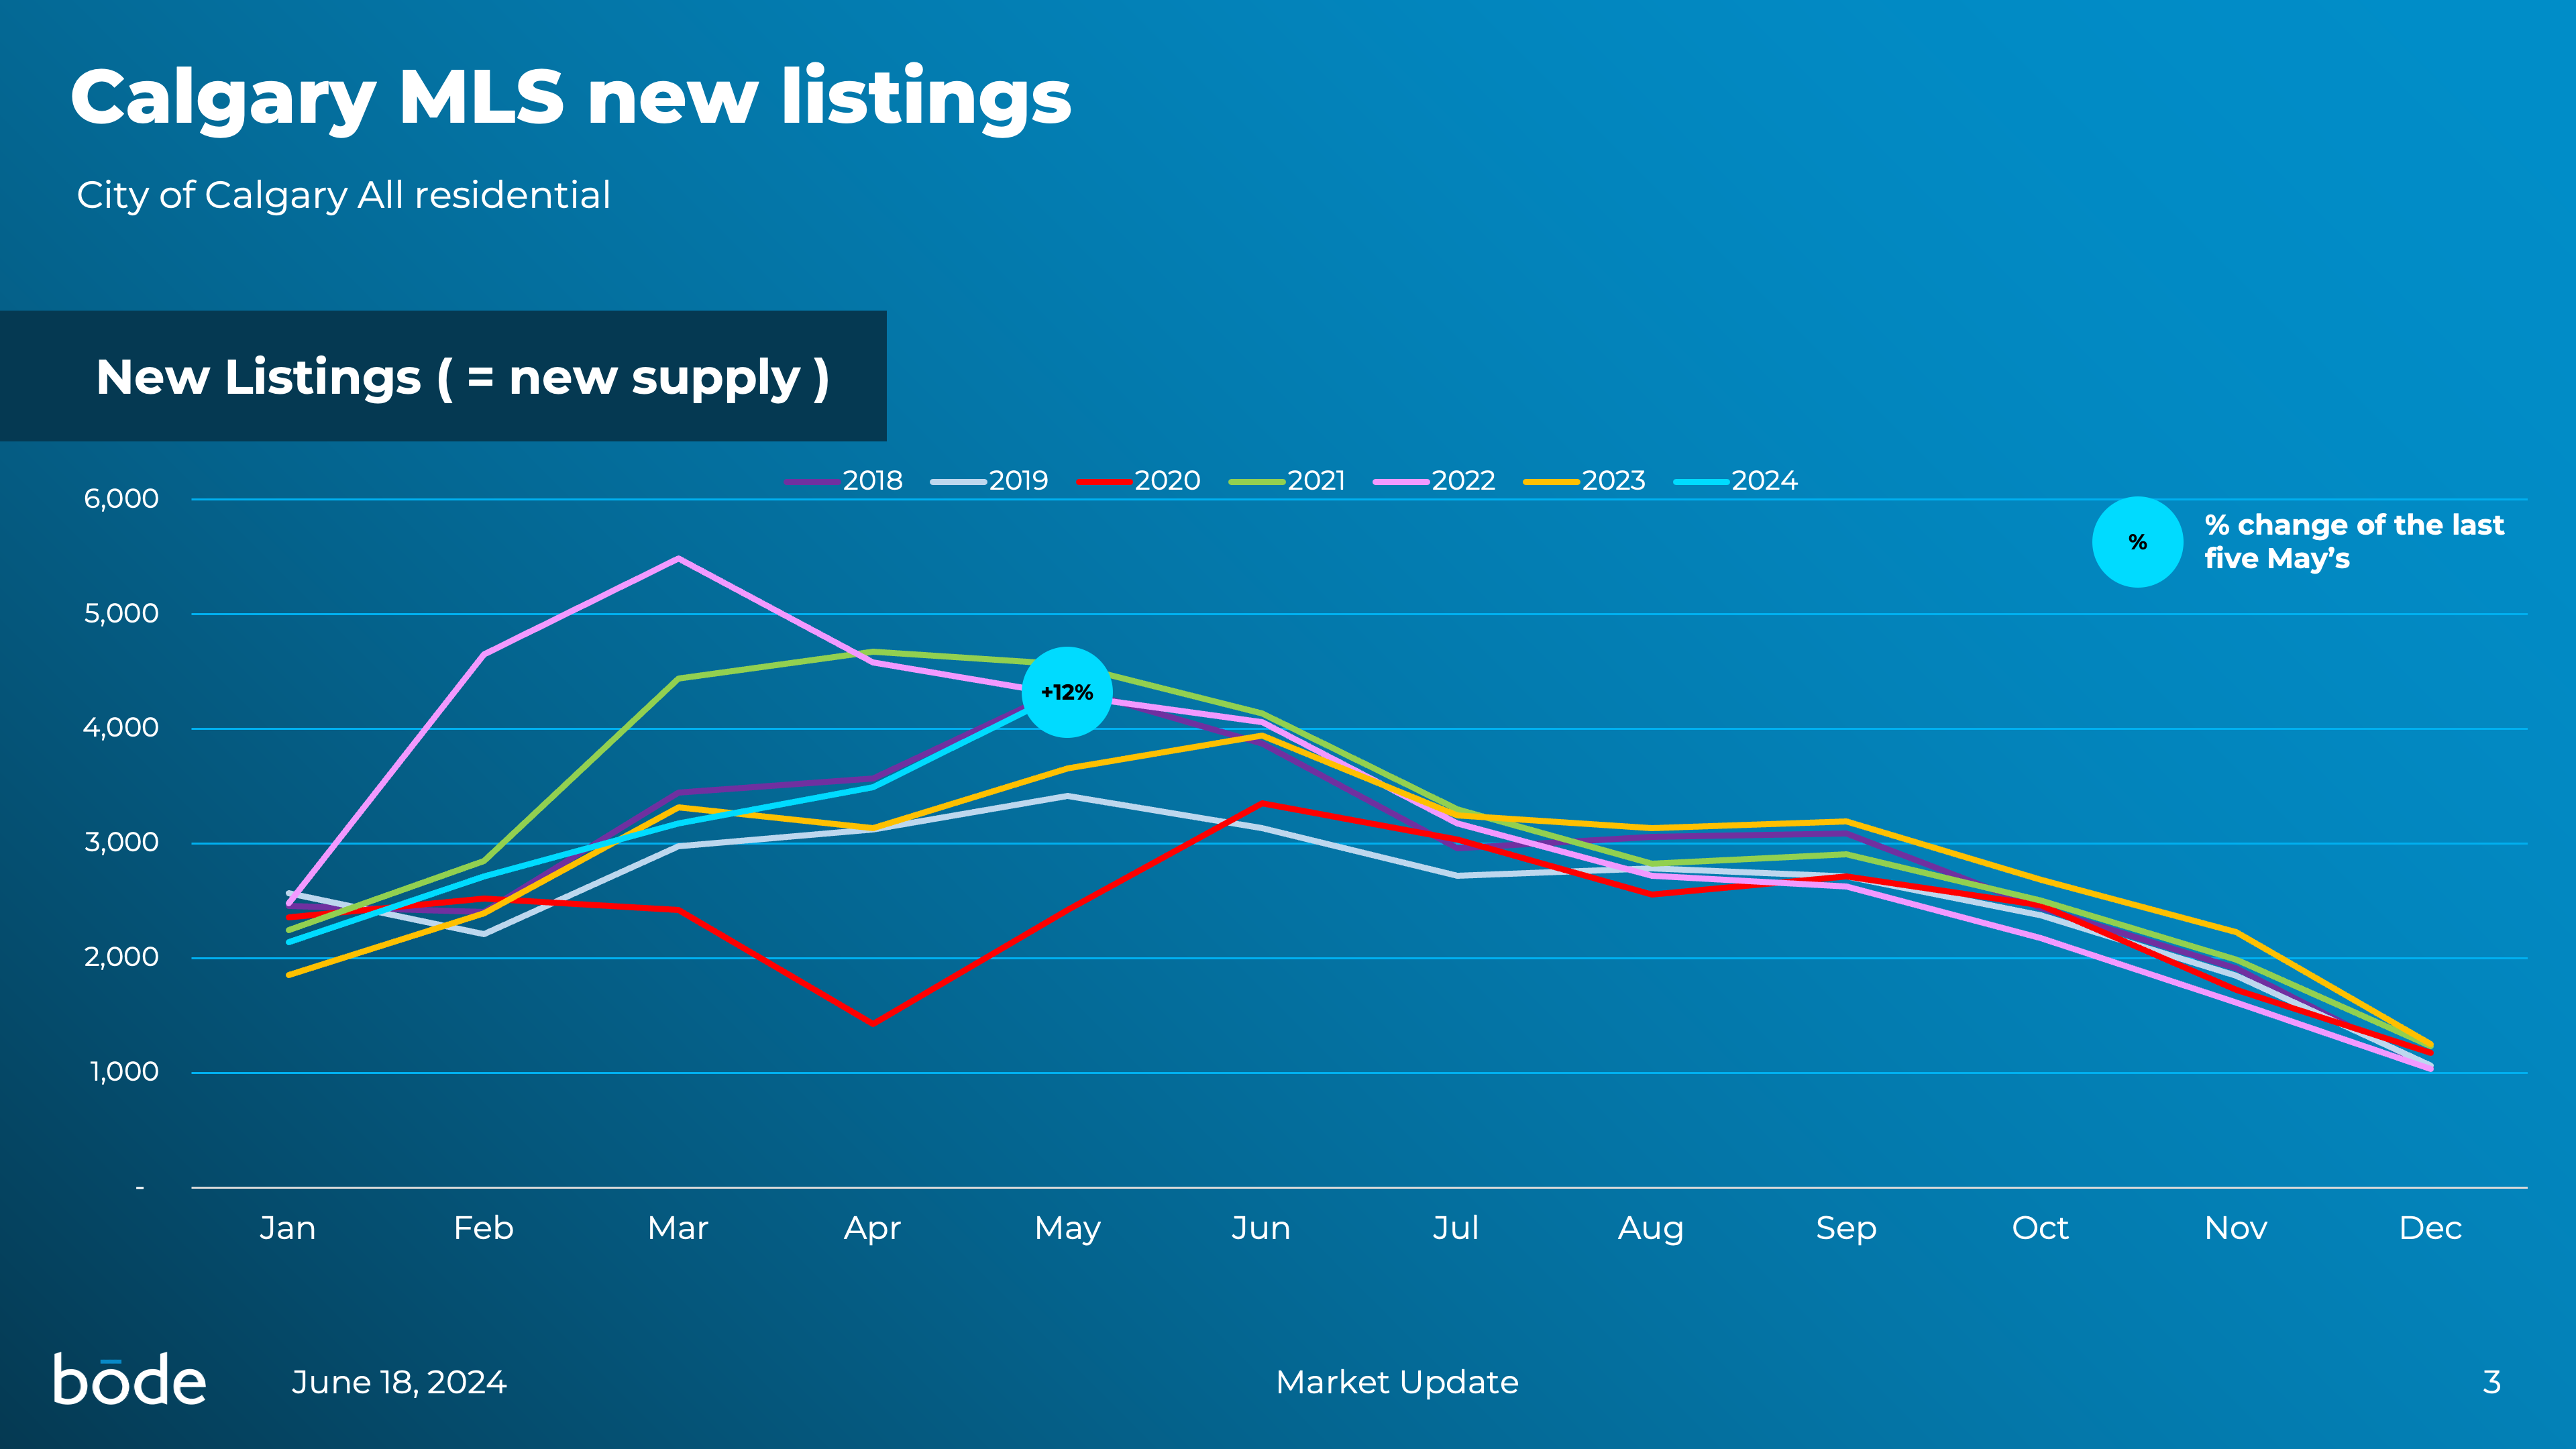
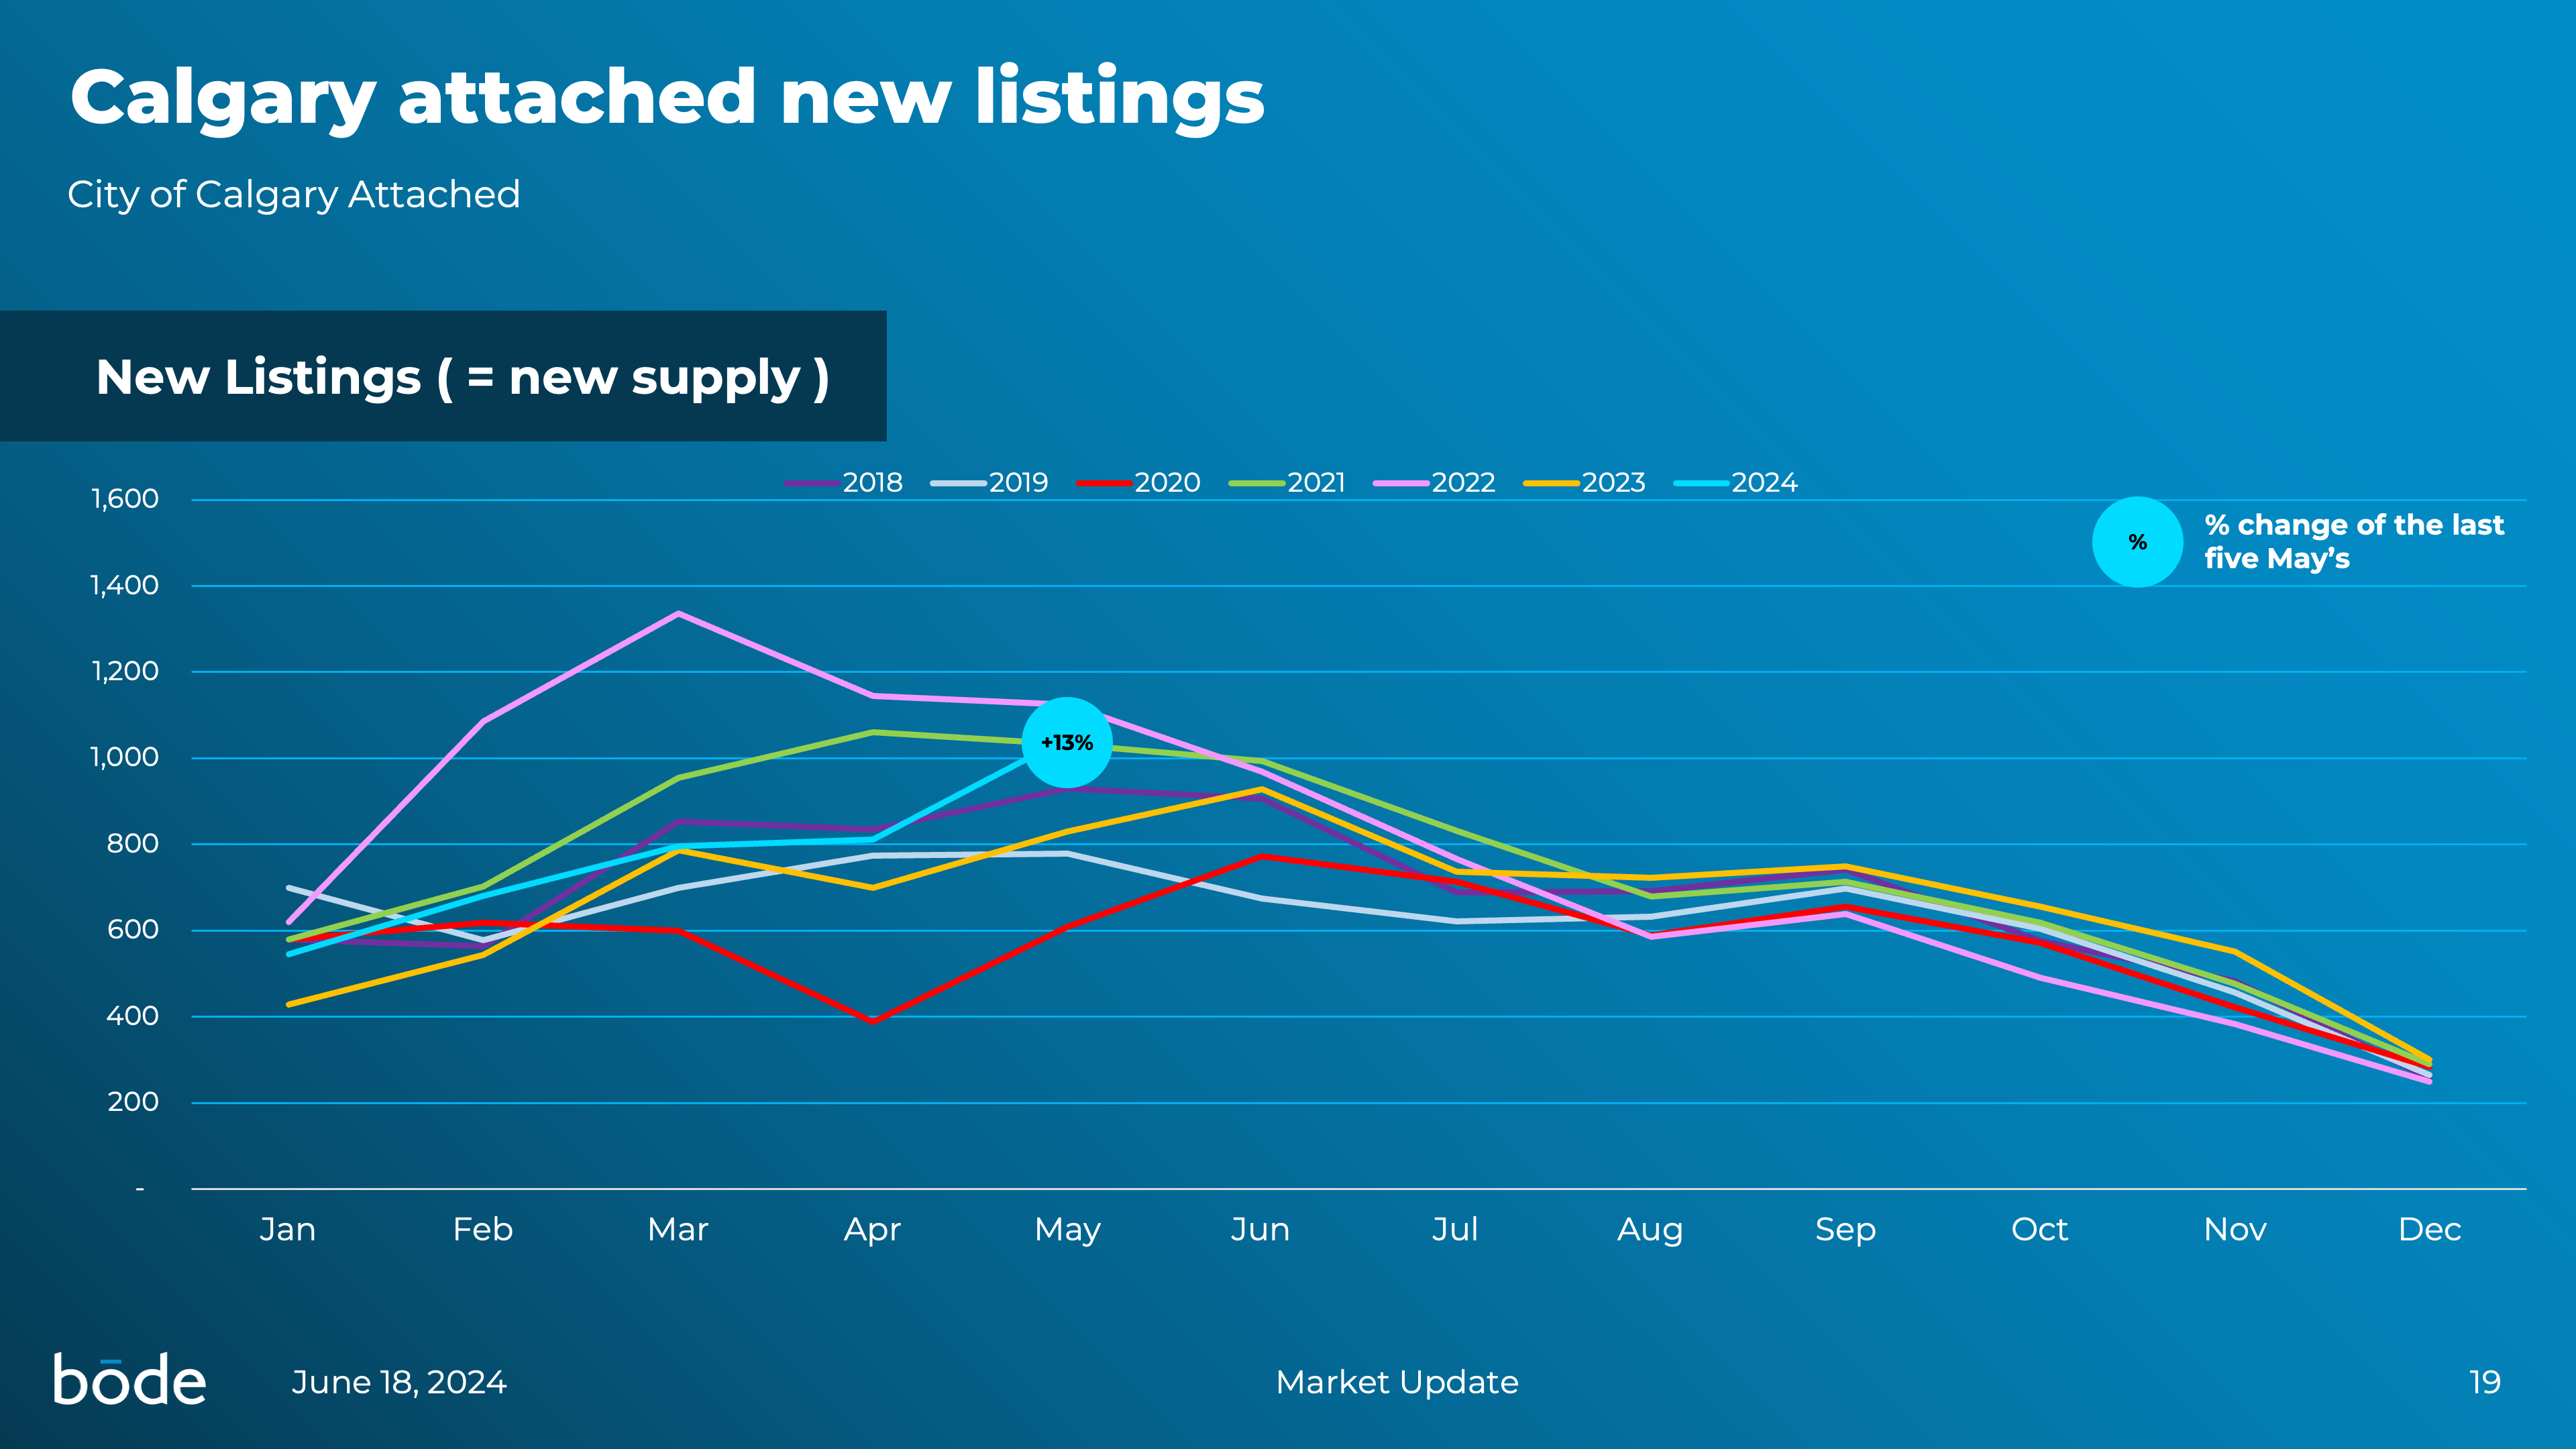
New supply: New Listings (i.e. the number of homes recently listed for sale)
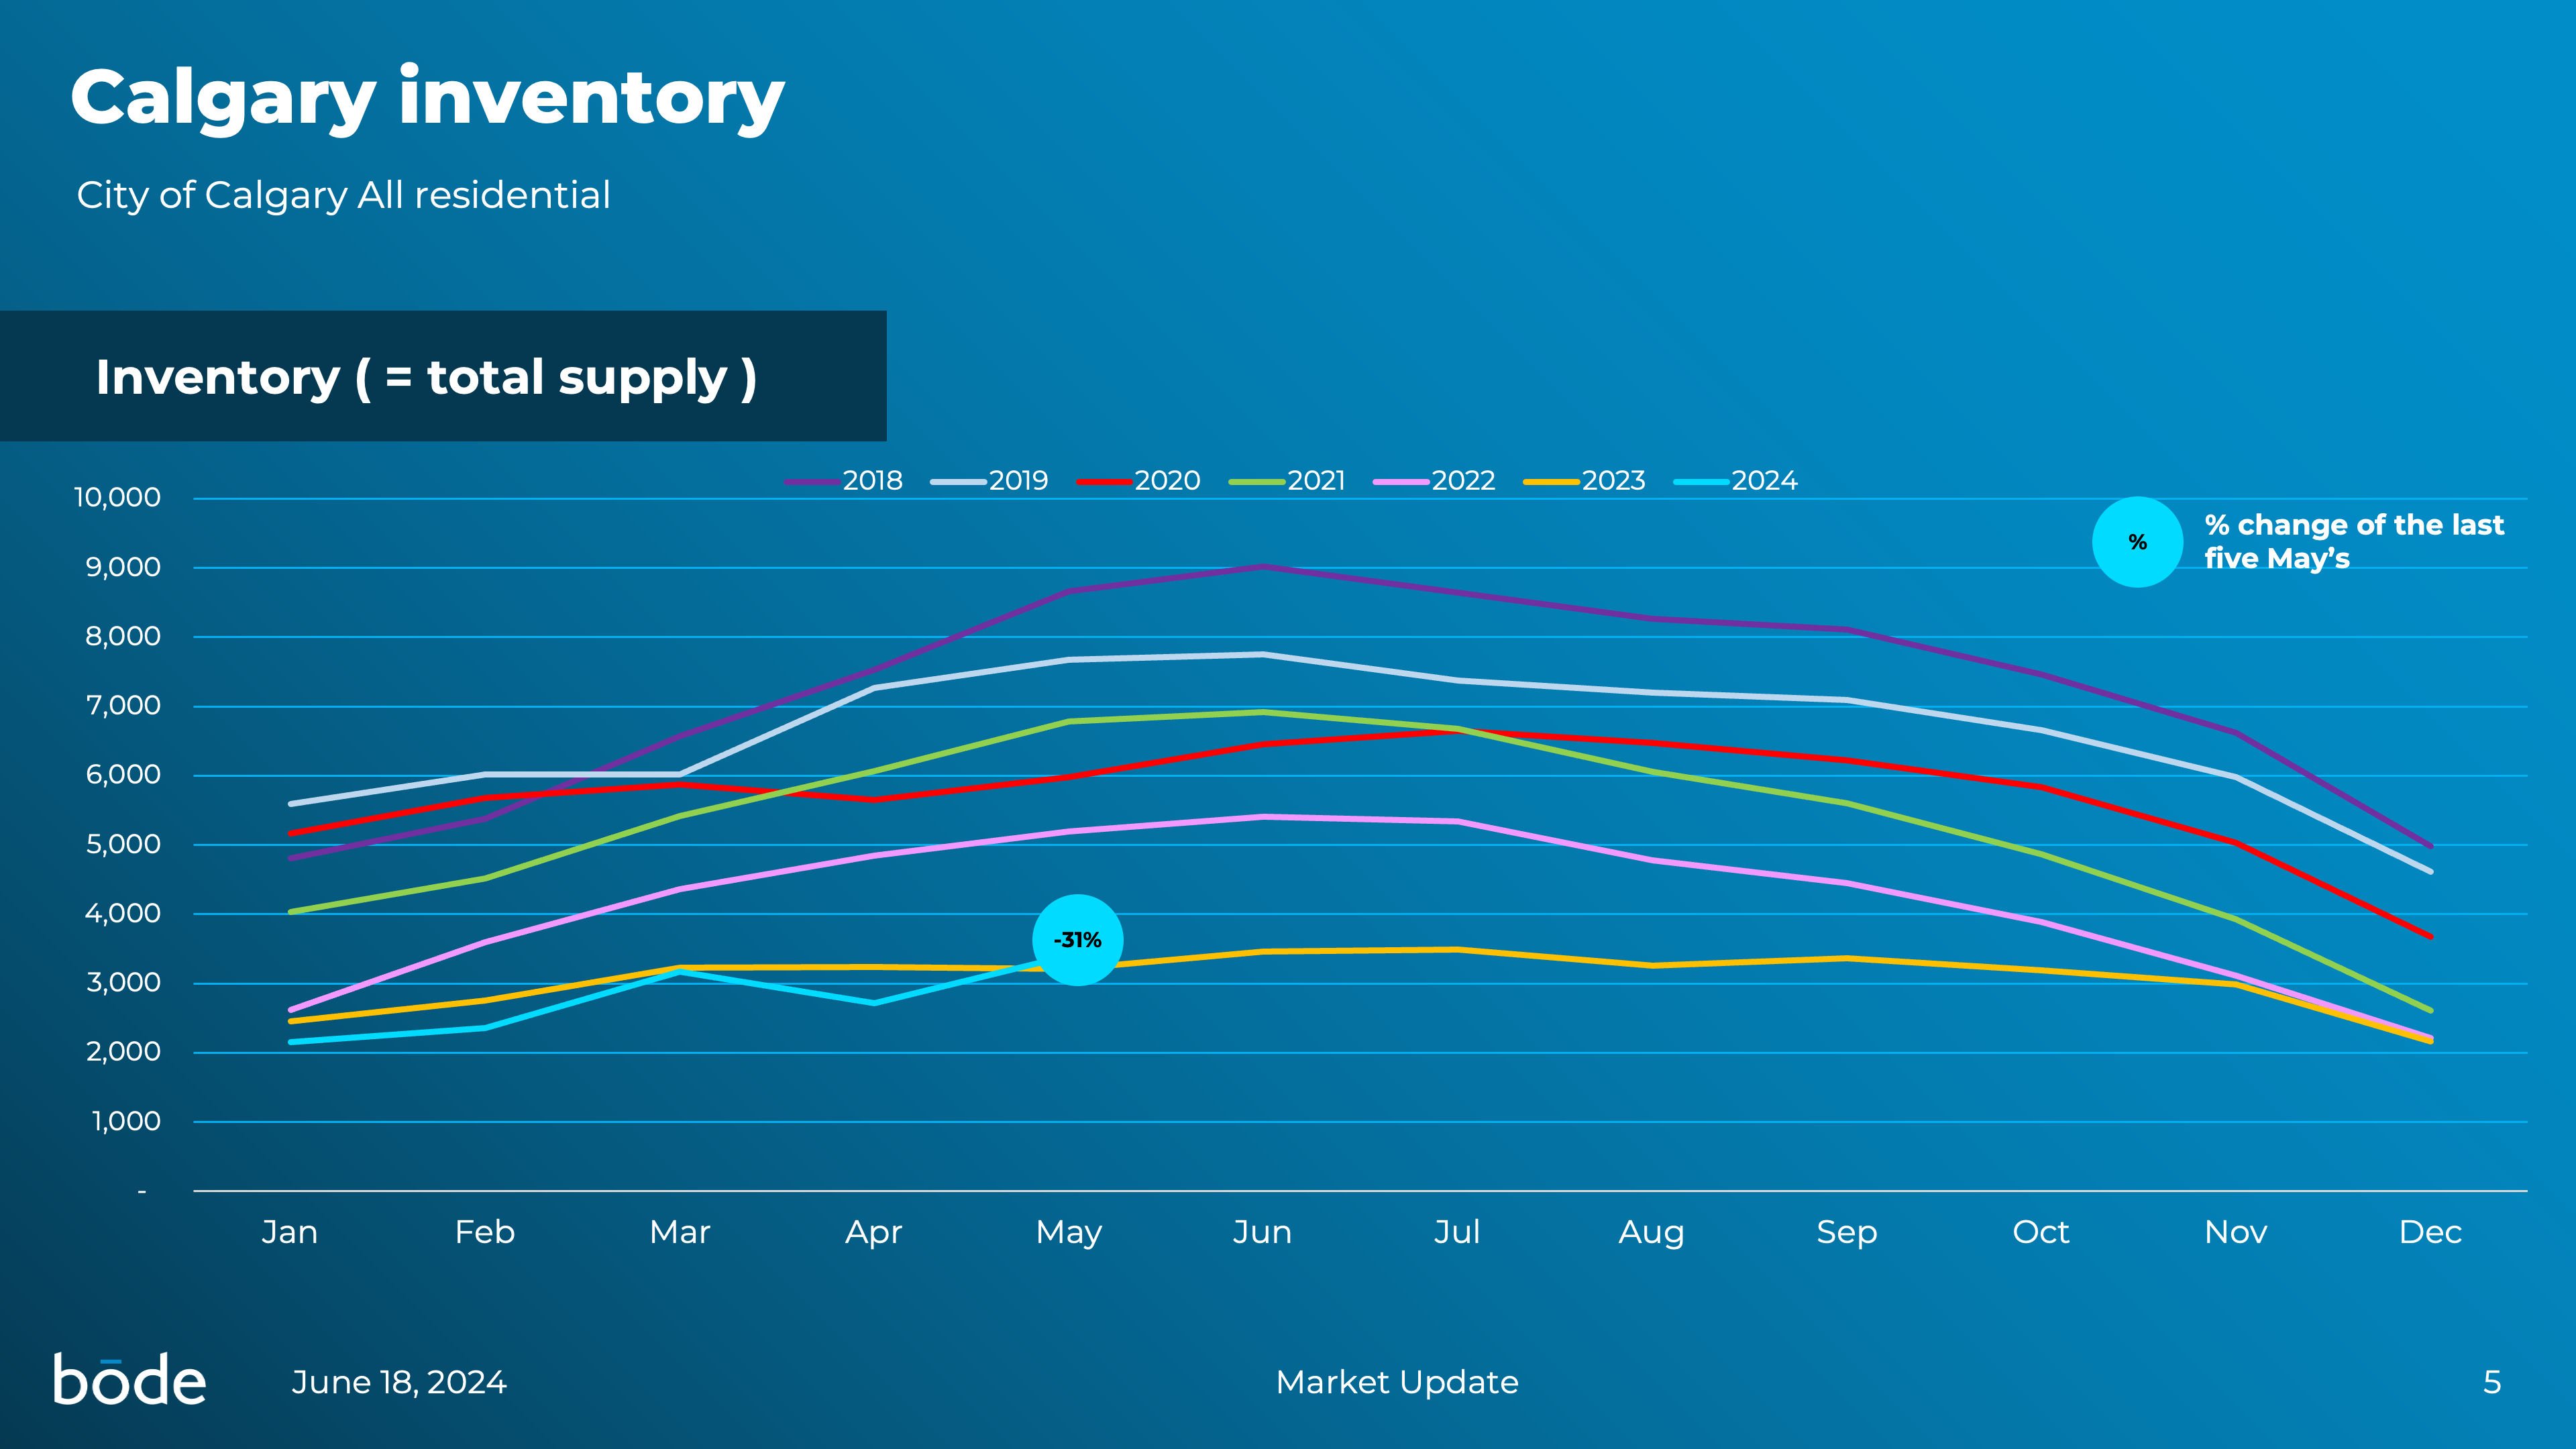
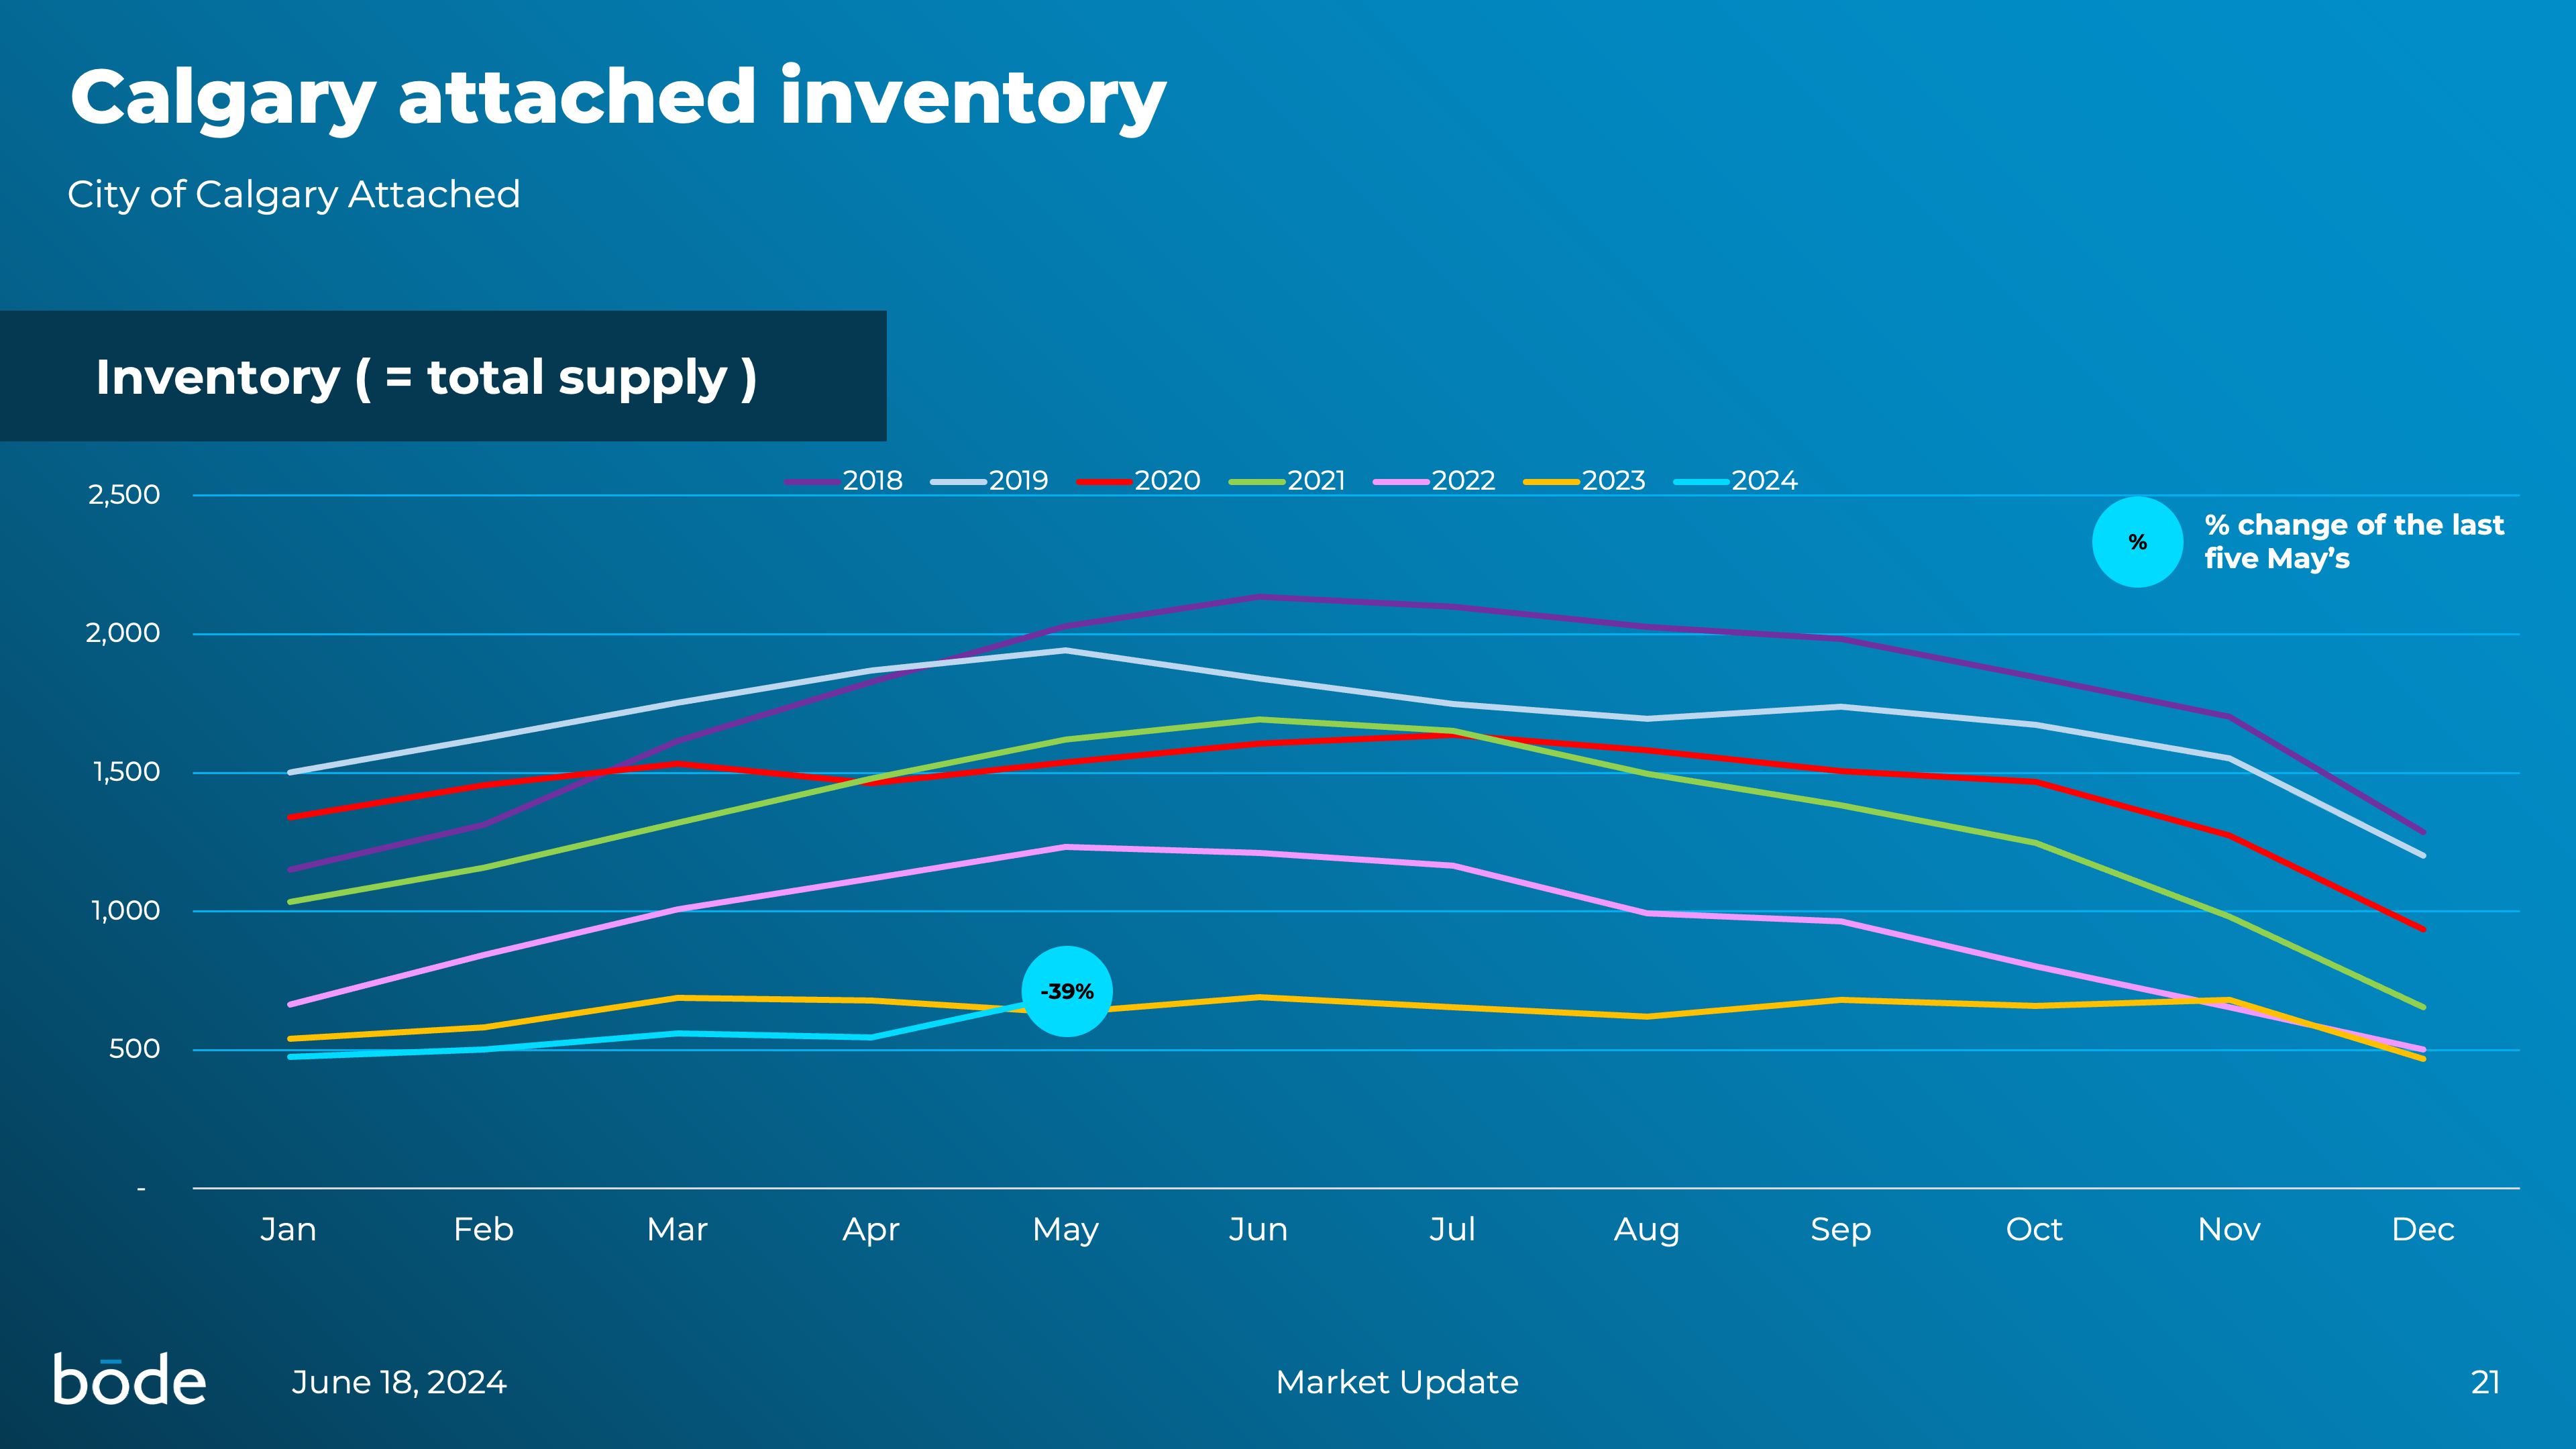
Total supply: Inventory (i.e. the total number of homes listed for sale)
Demand
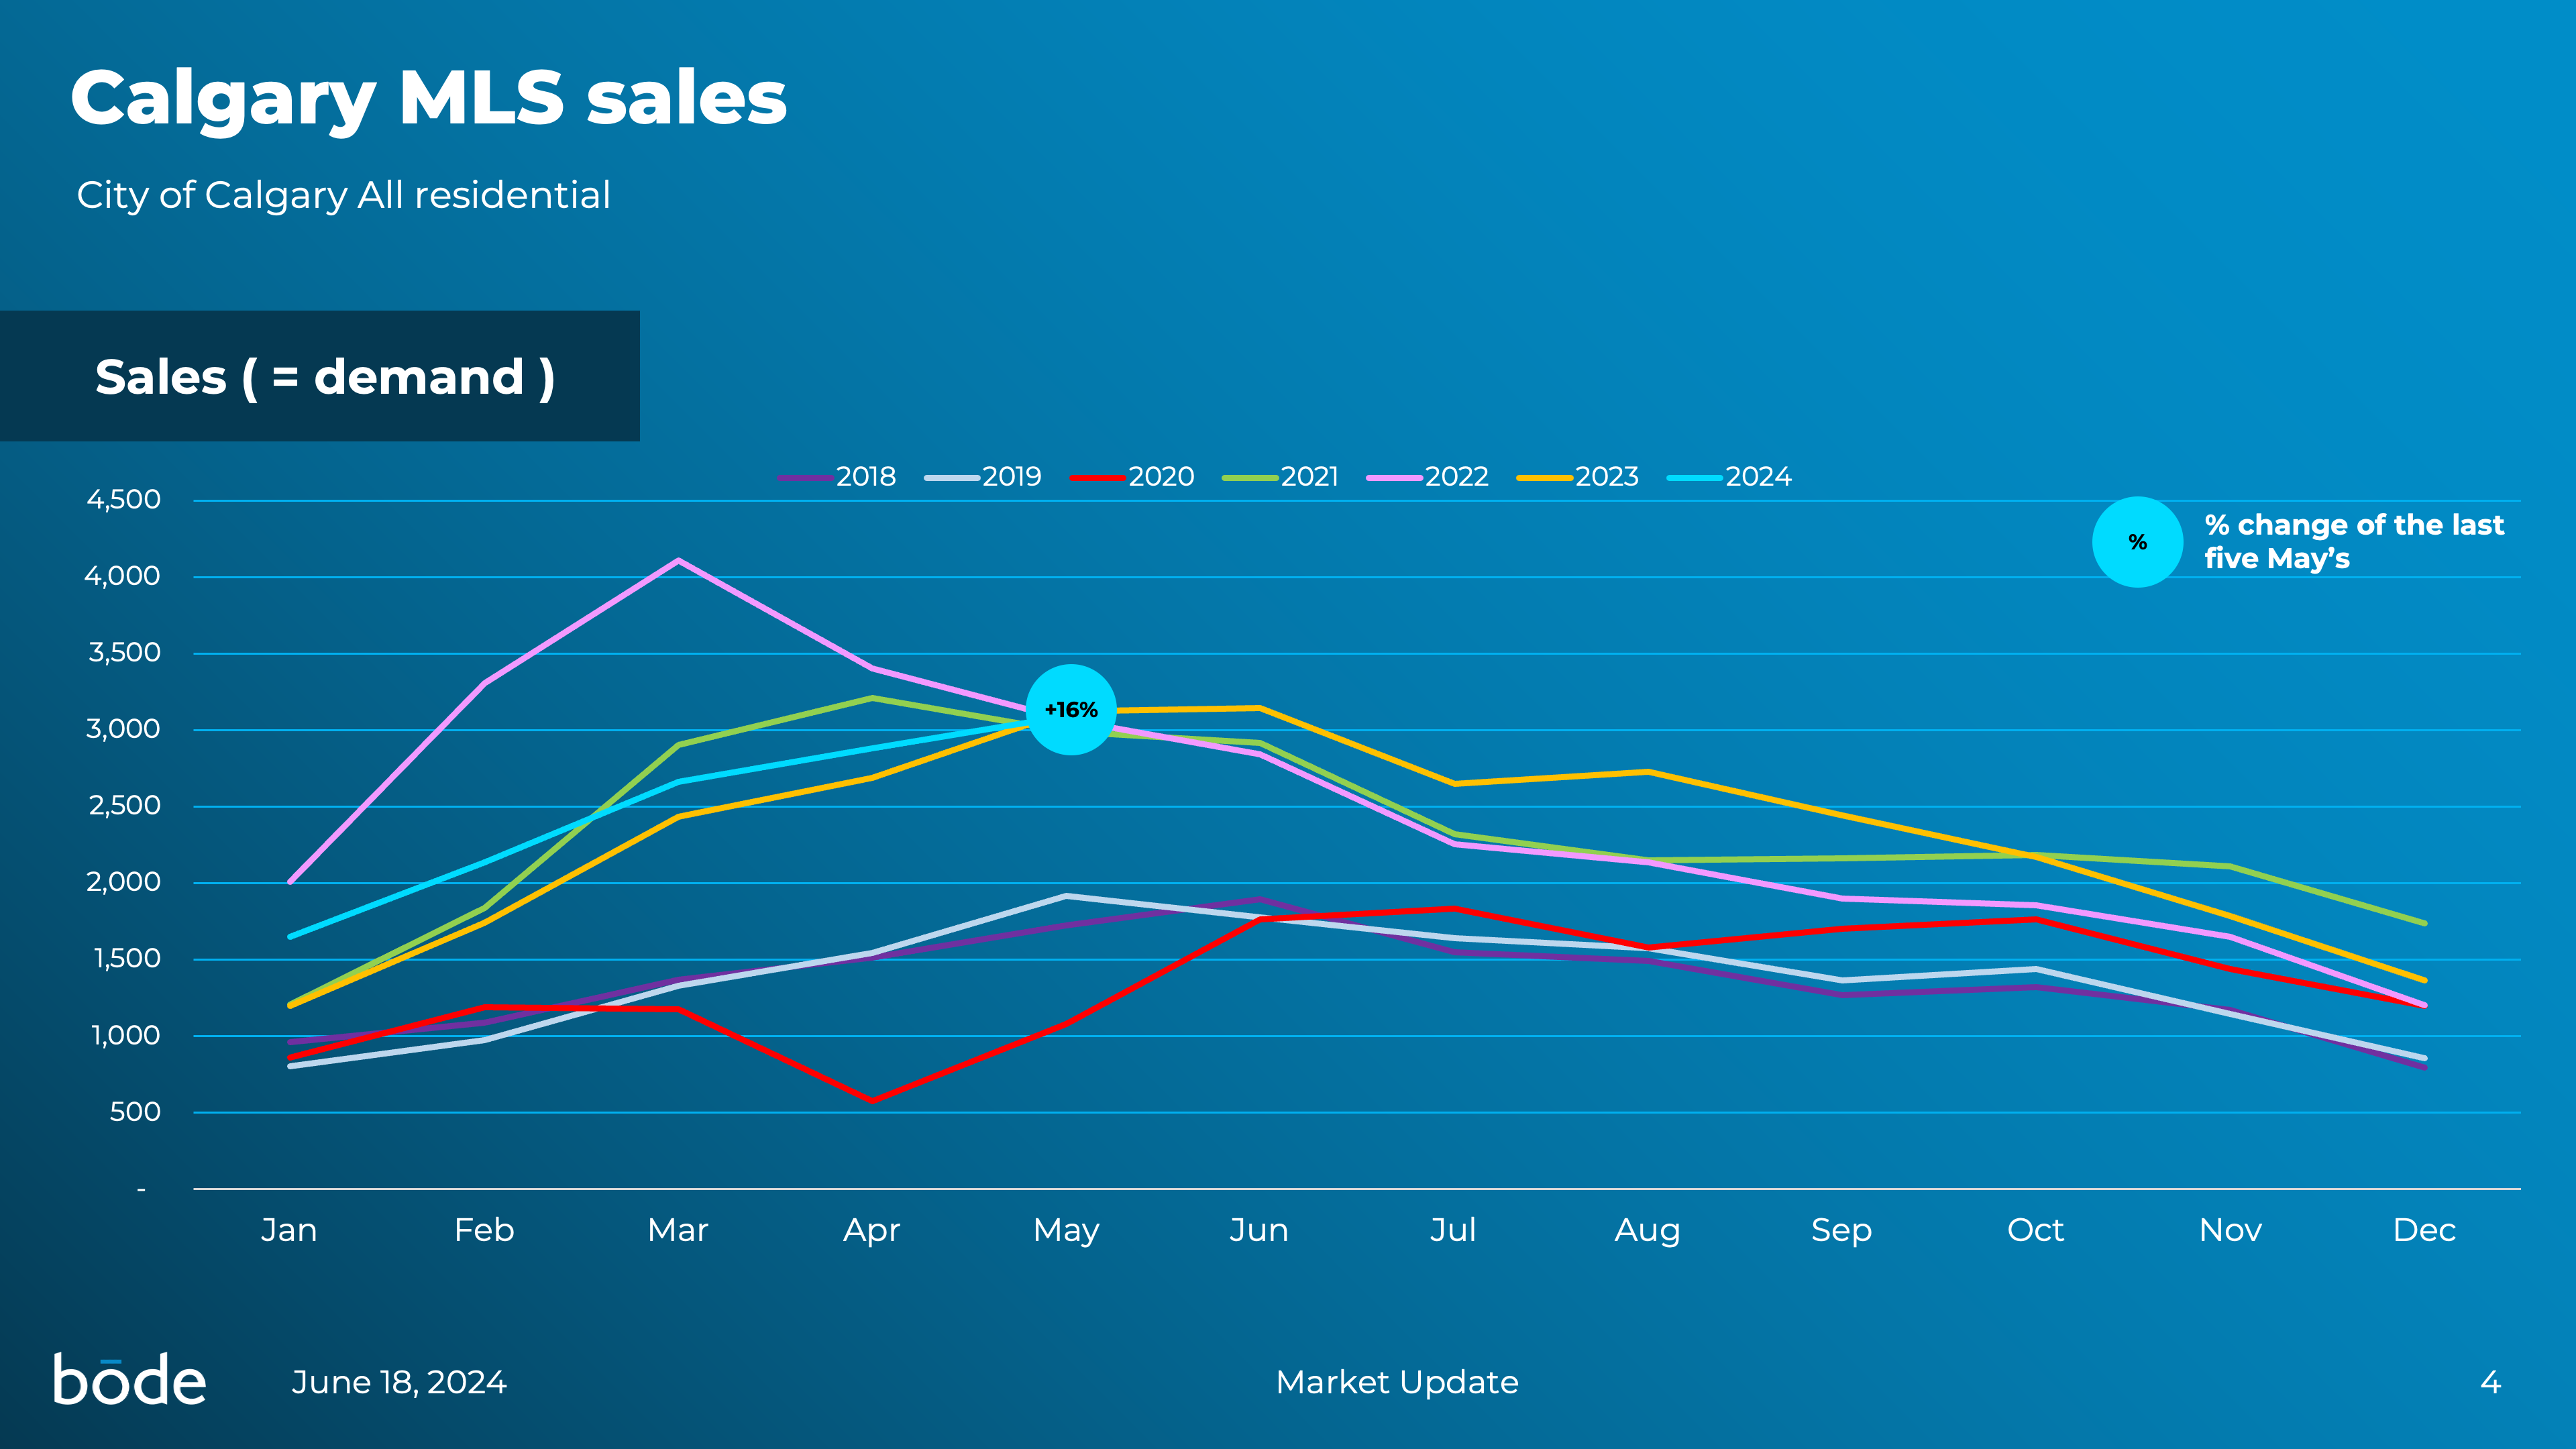
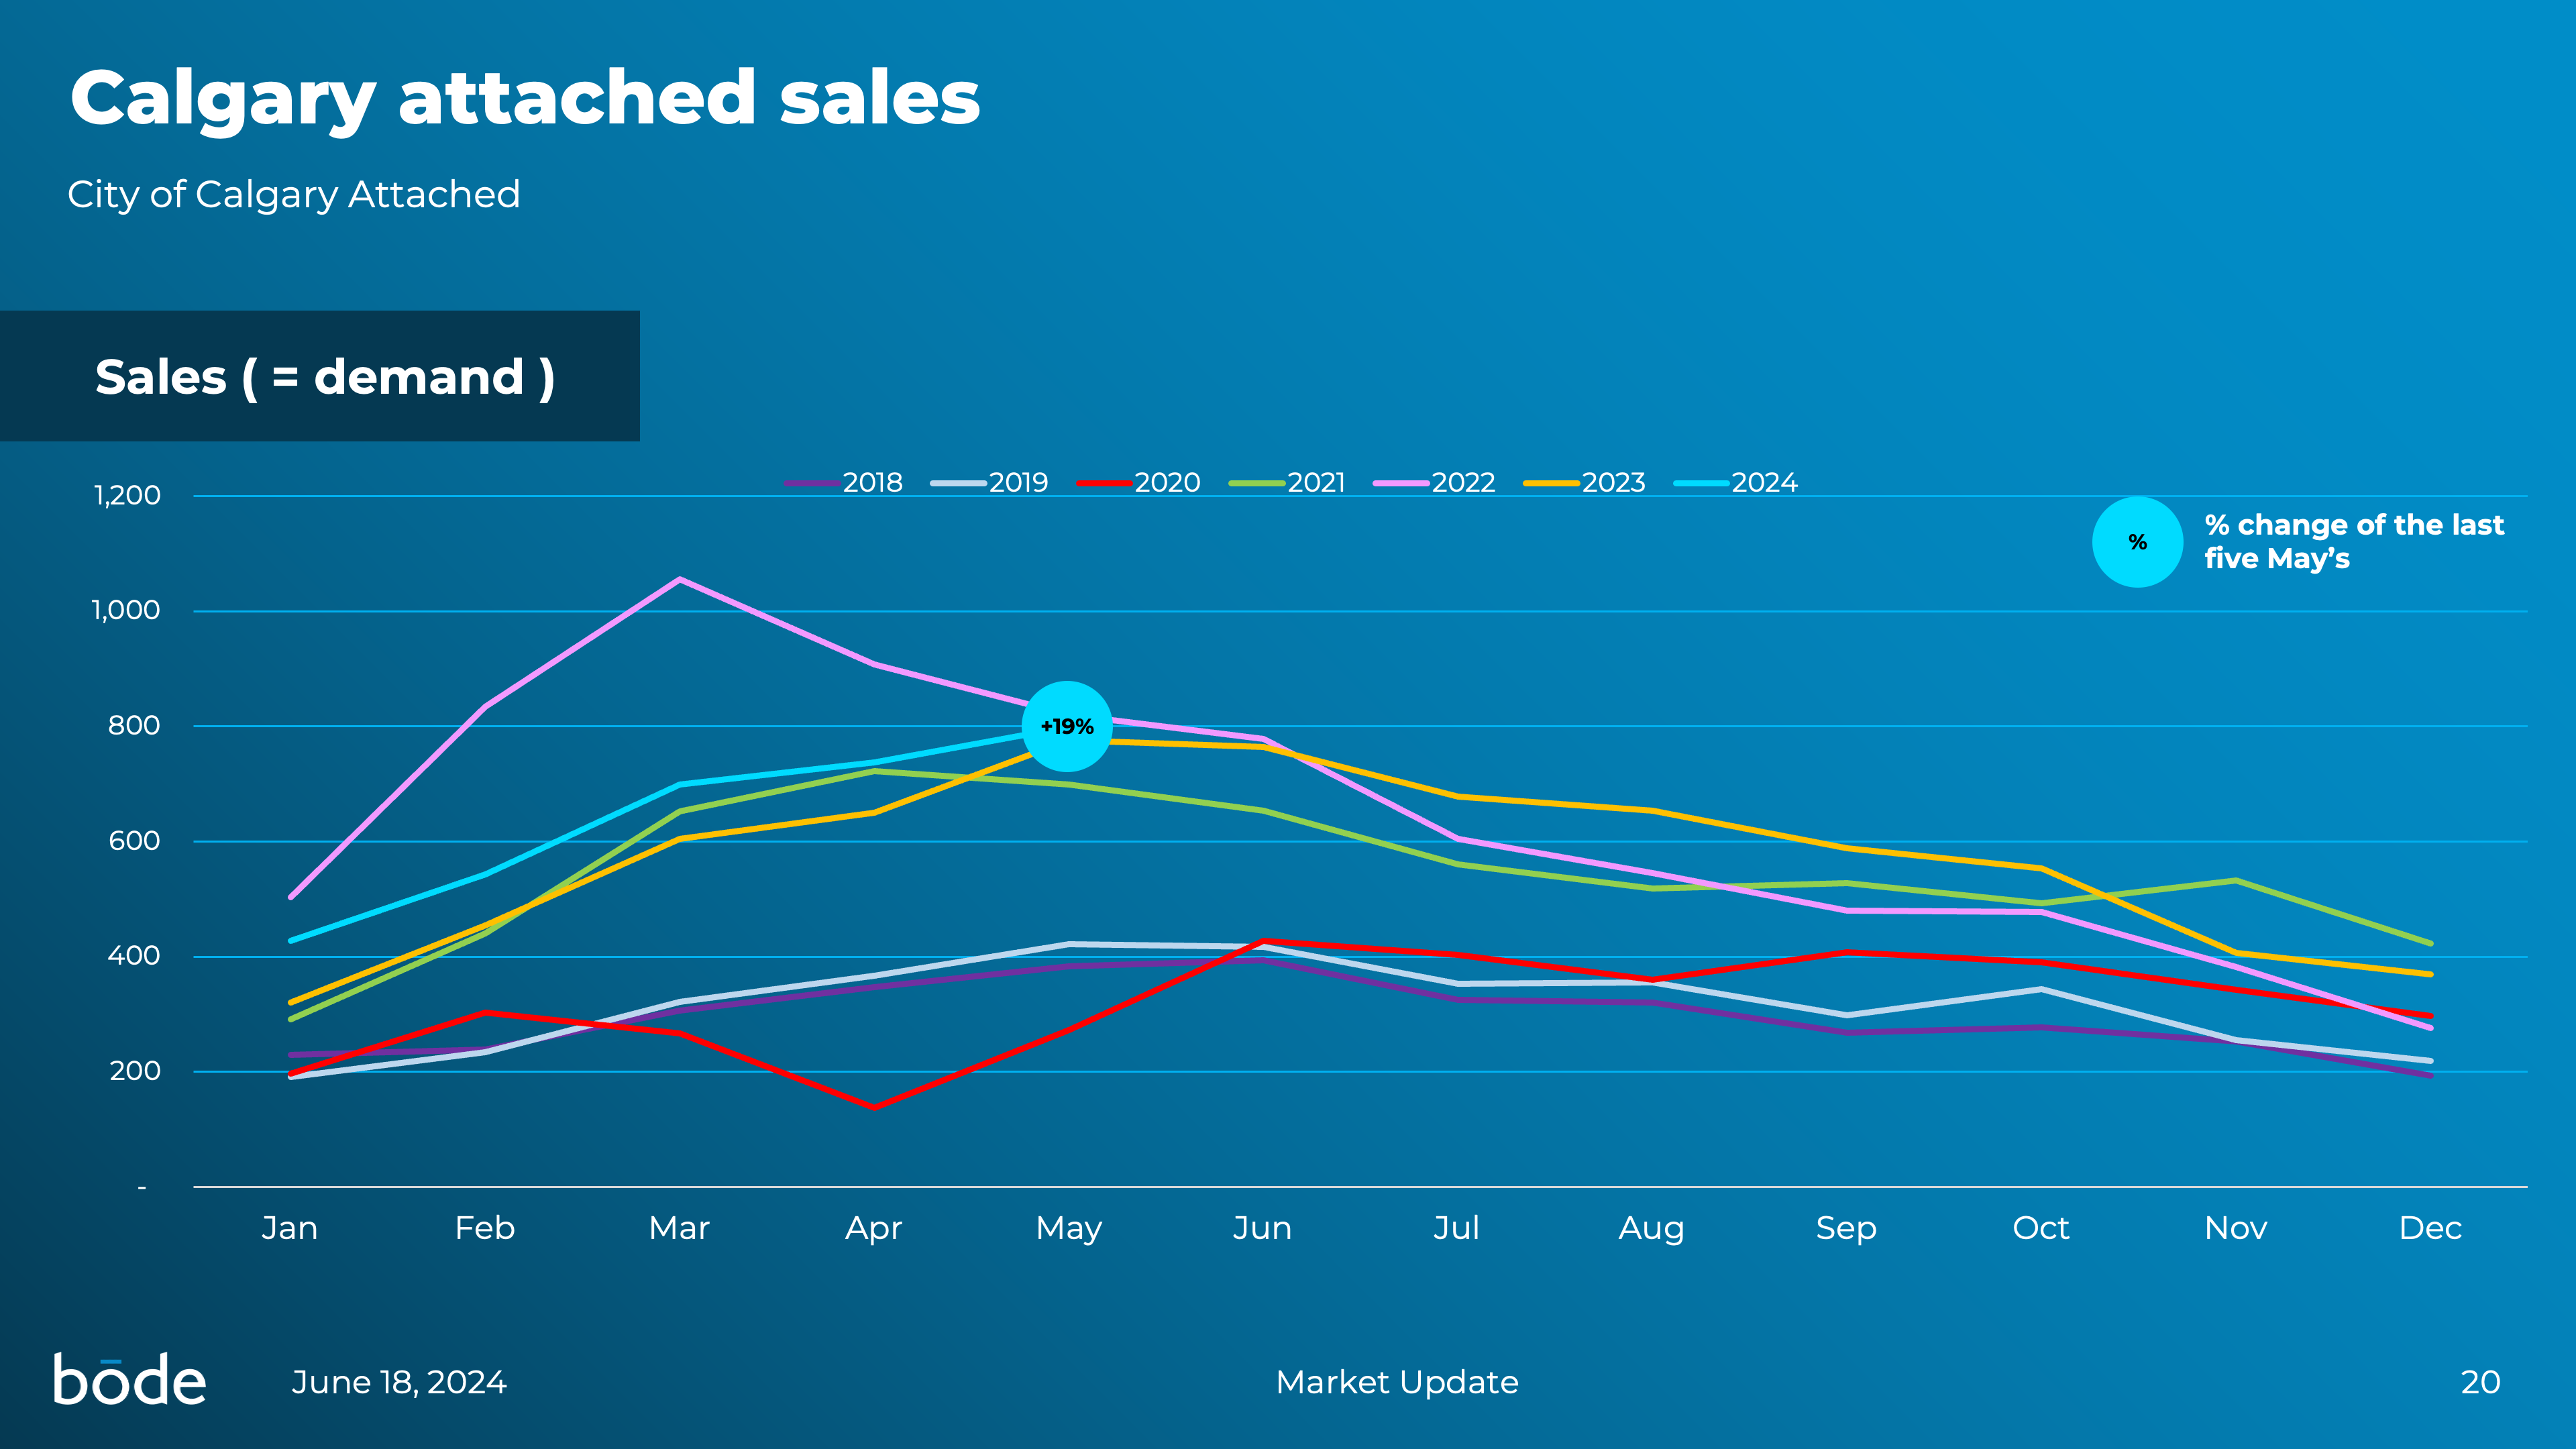
Sales (i.e. the number of homes recently sold)
Supply & Demand
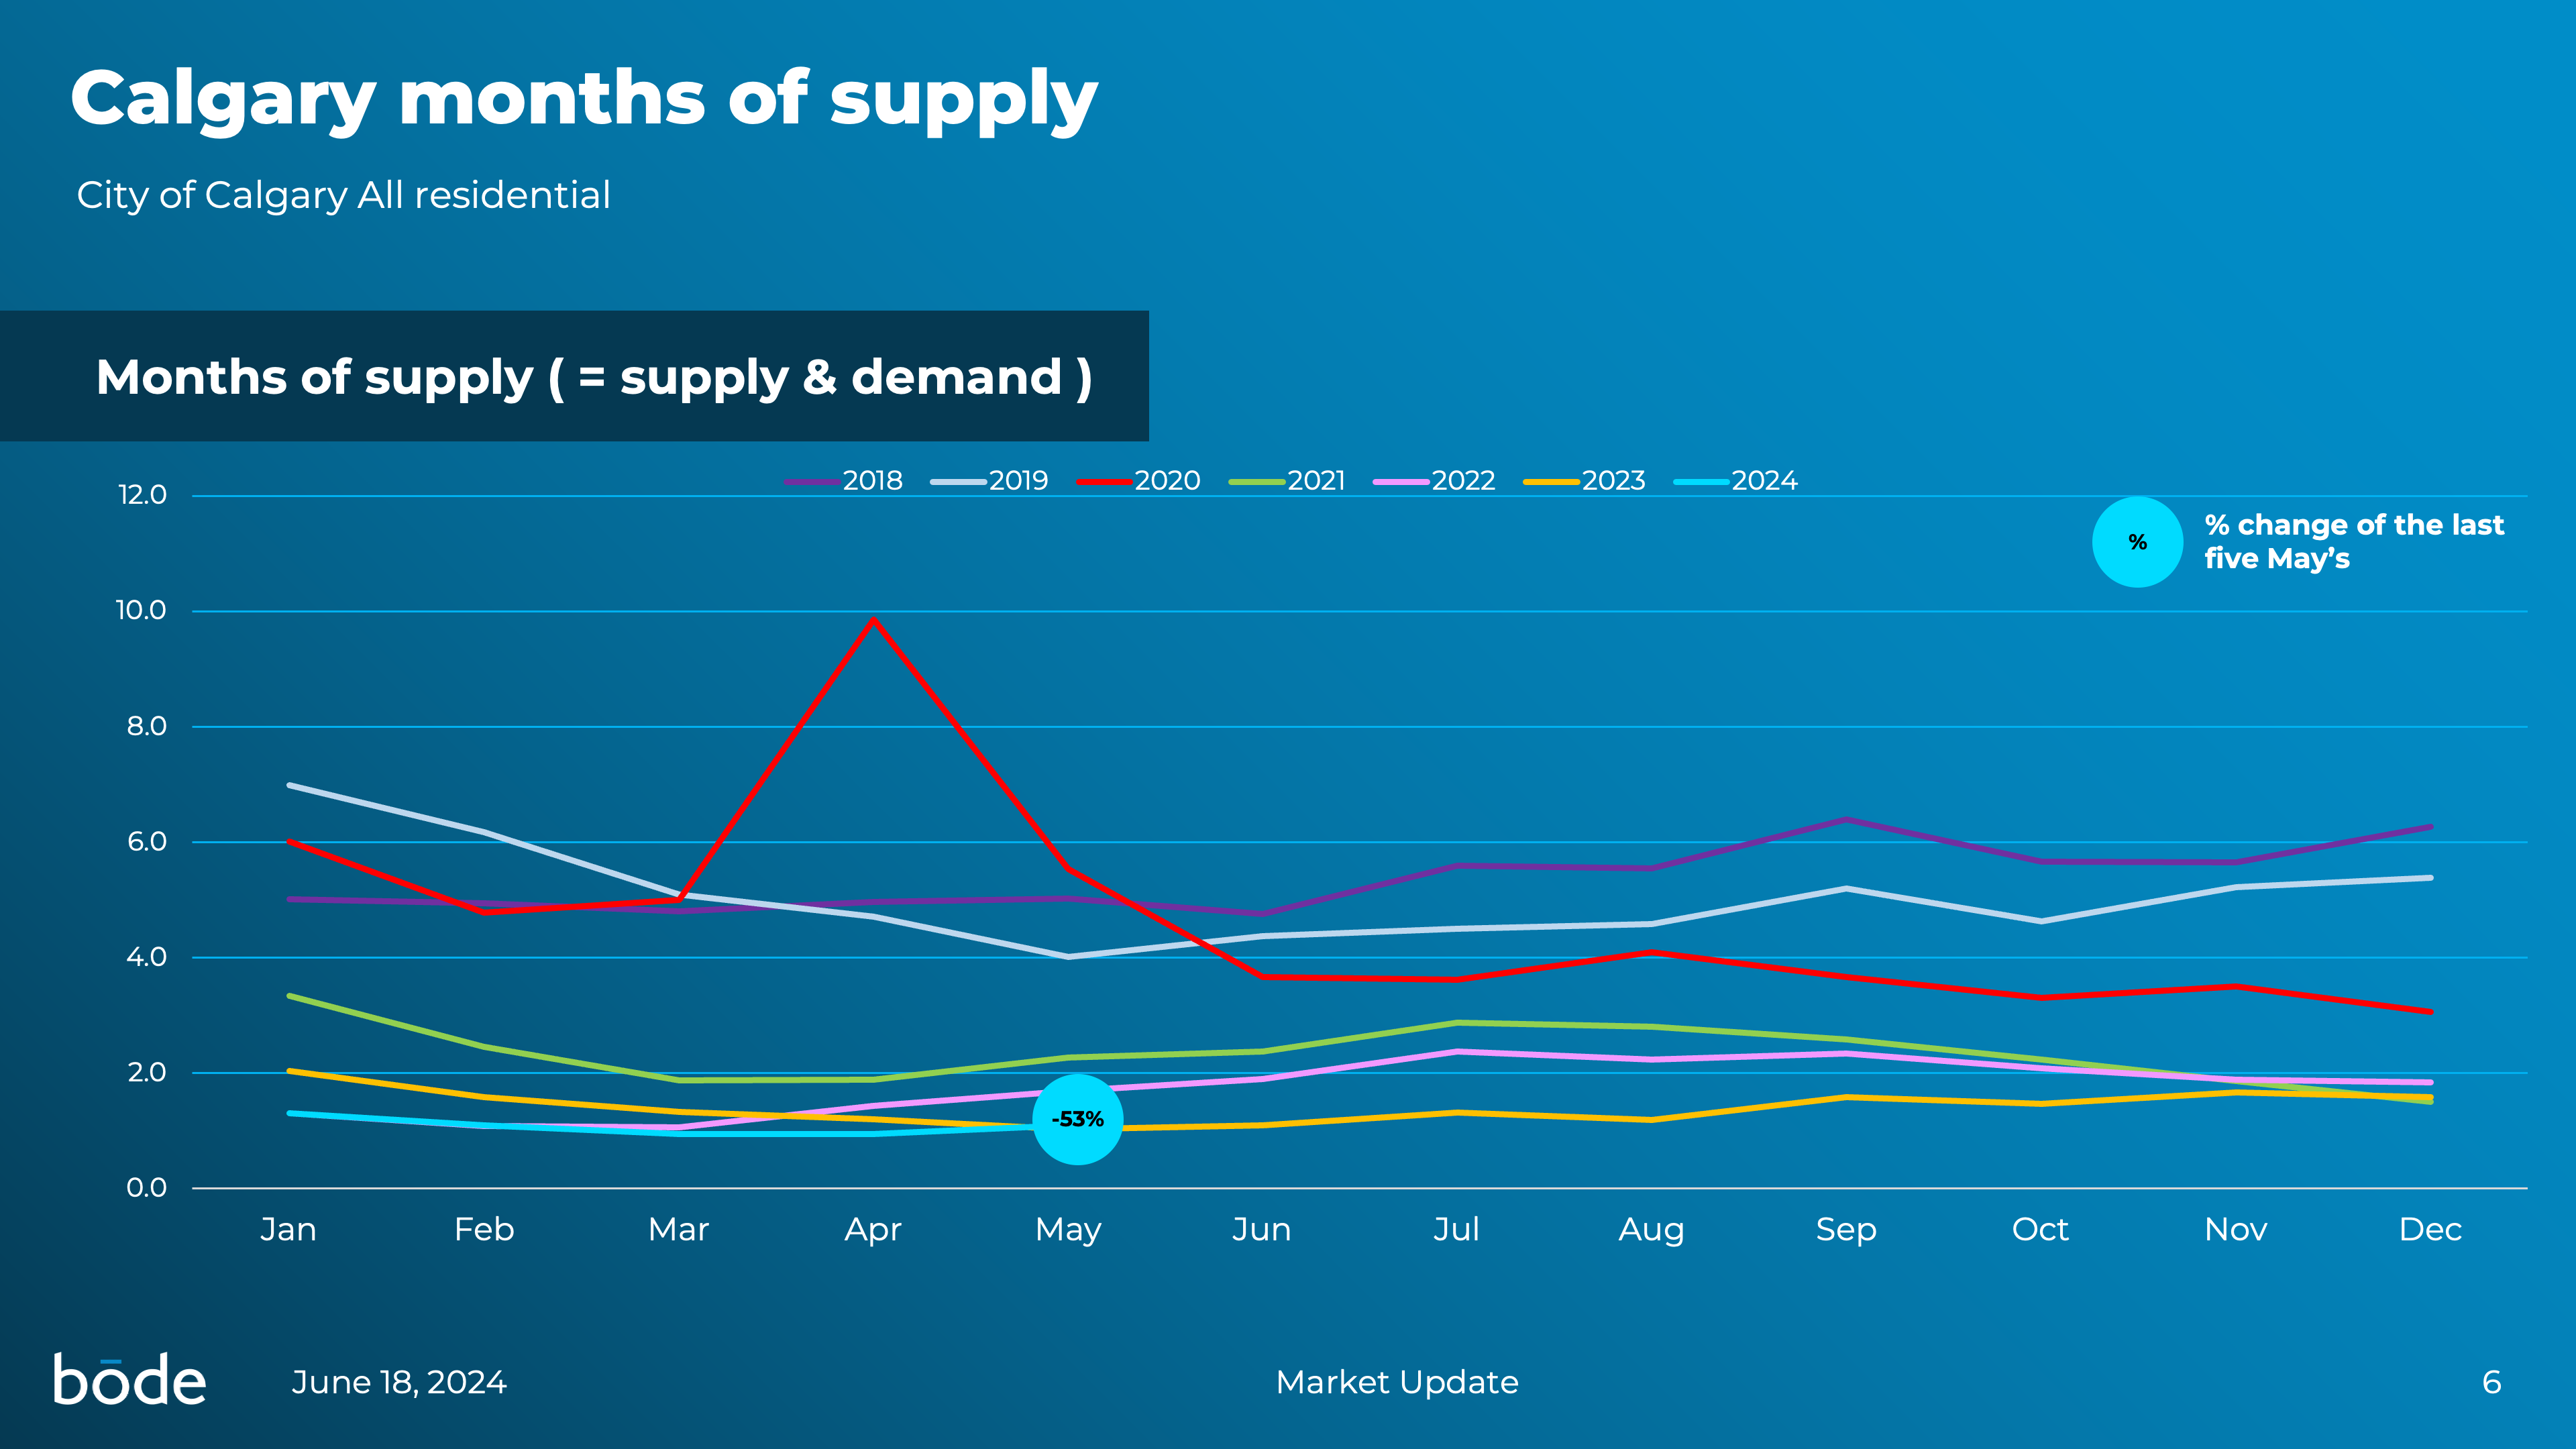
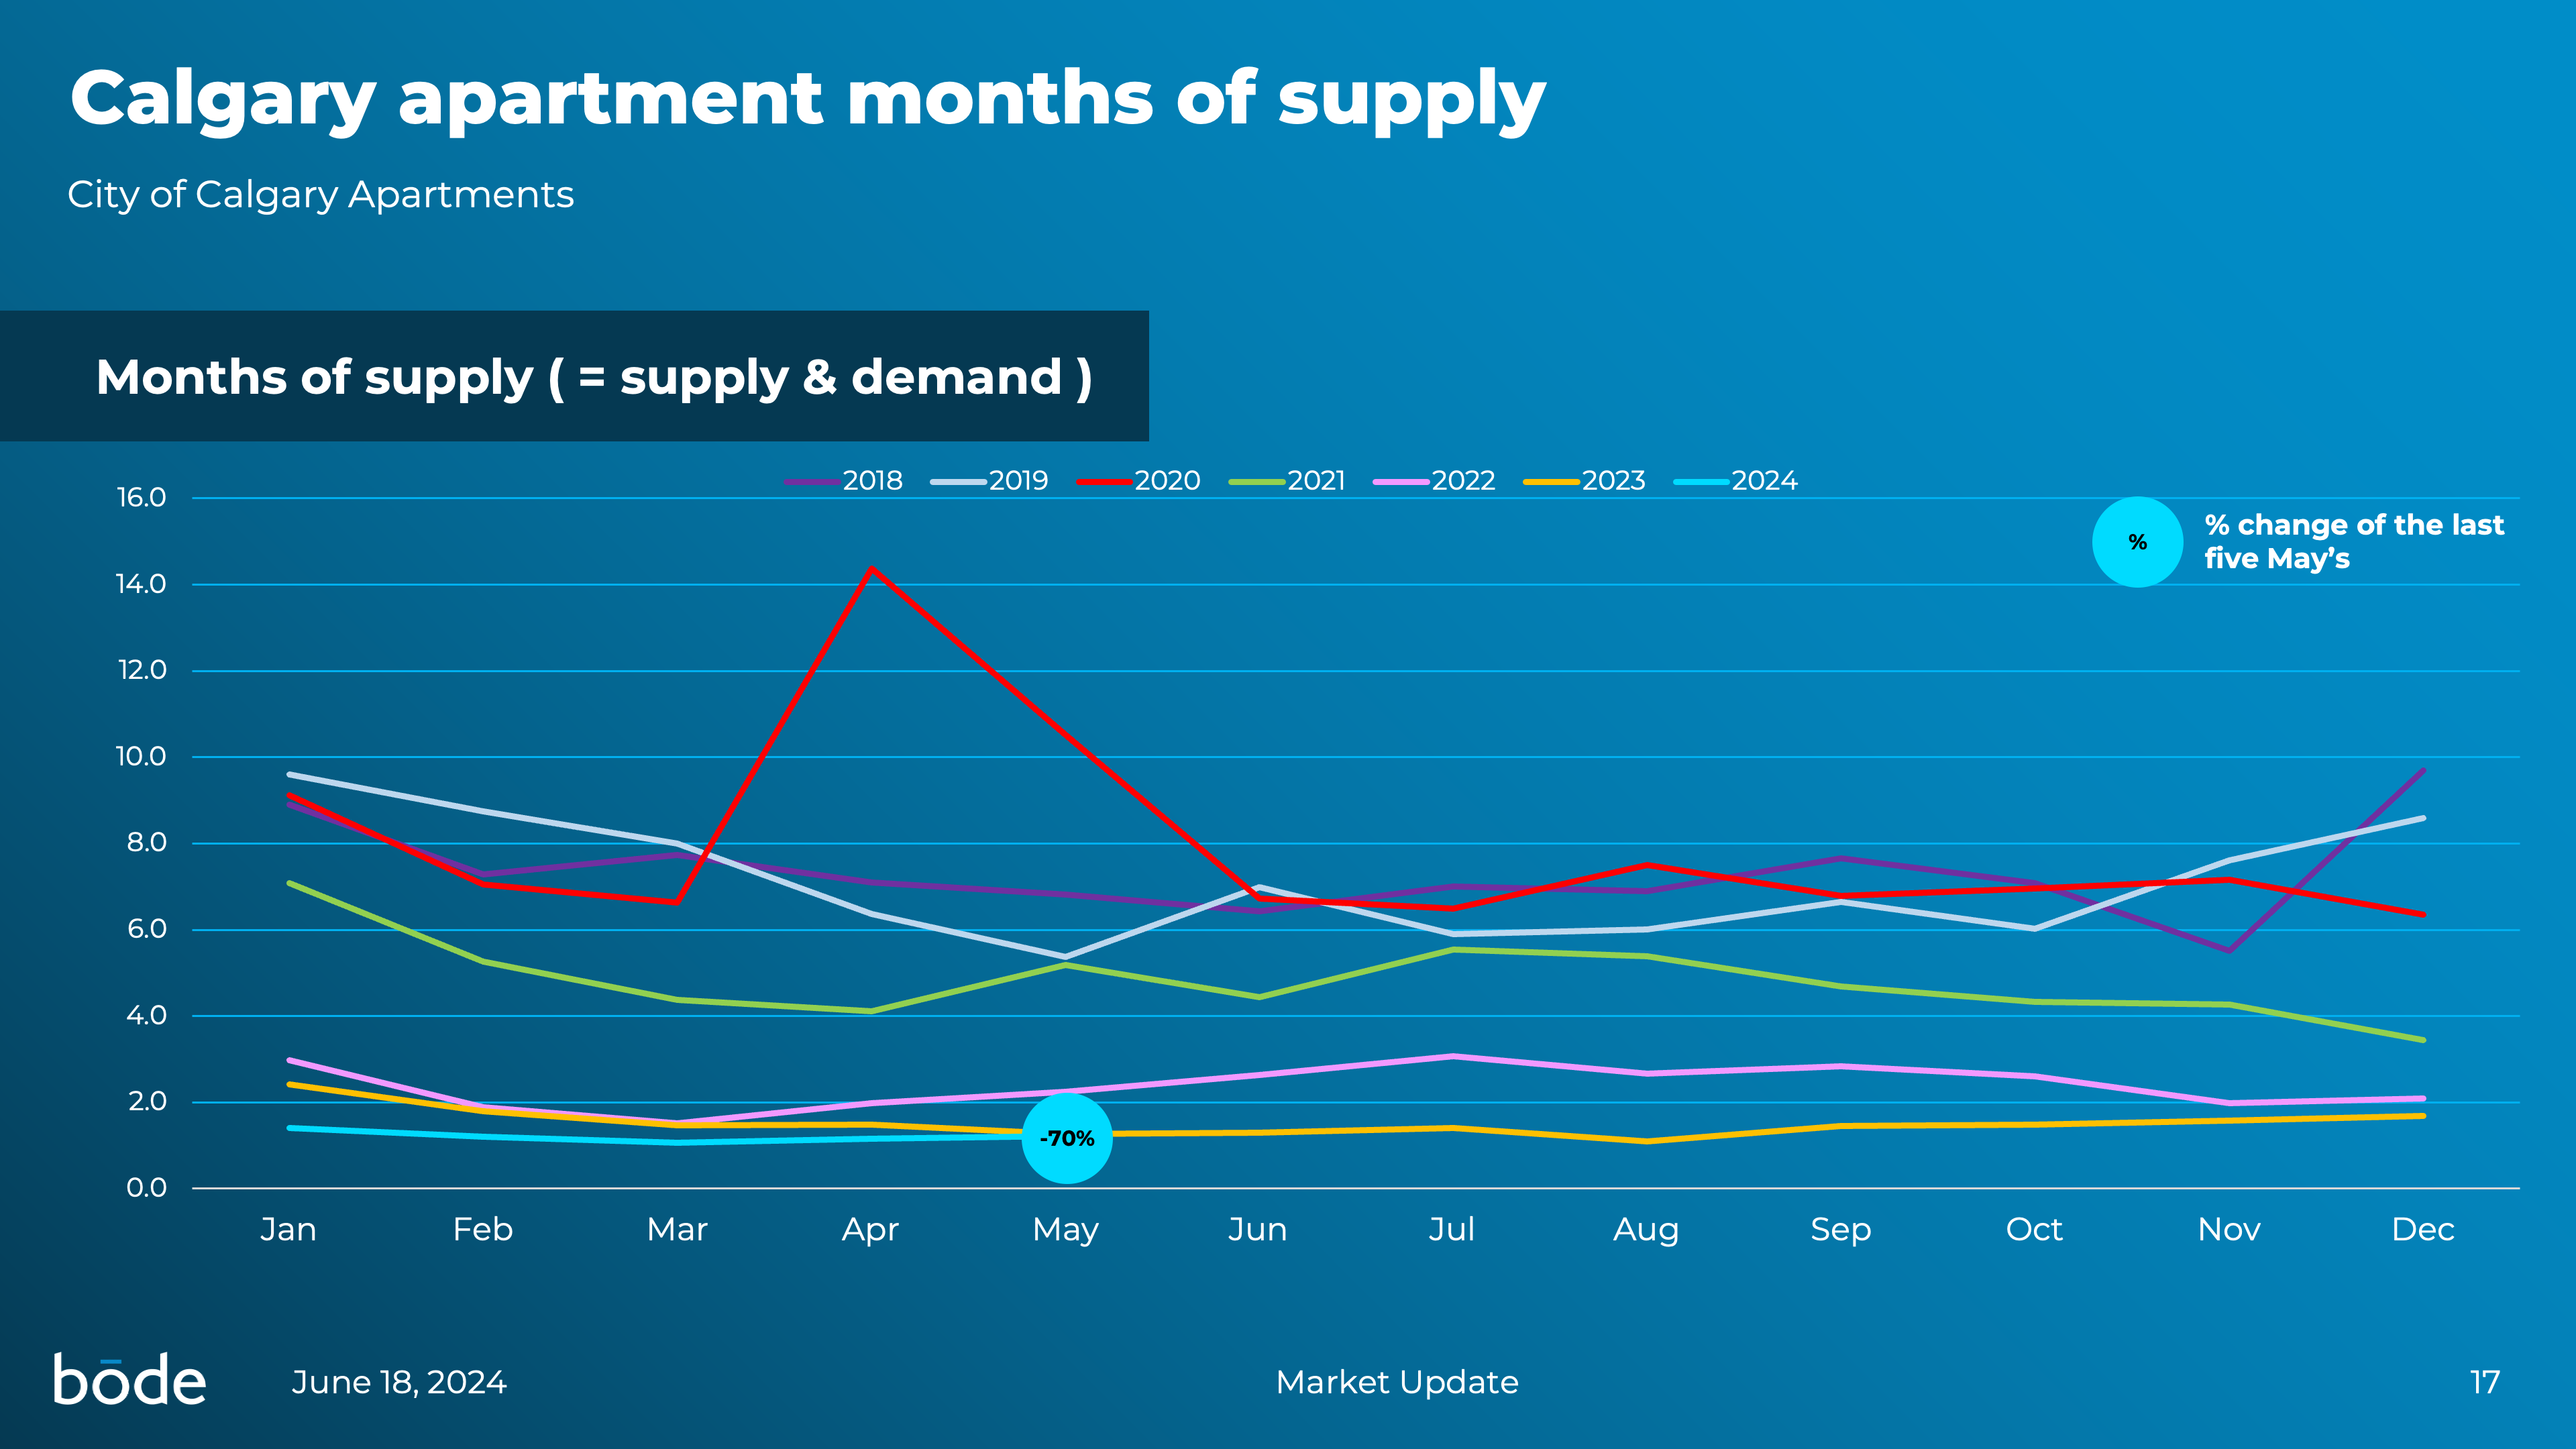
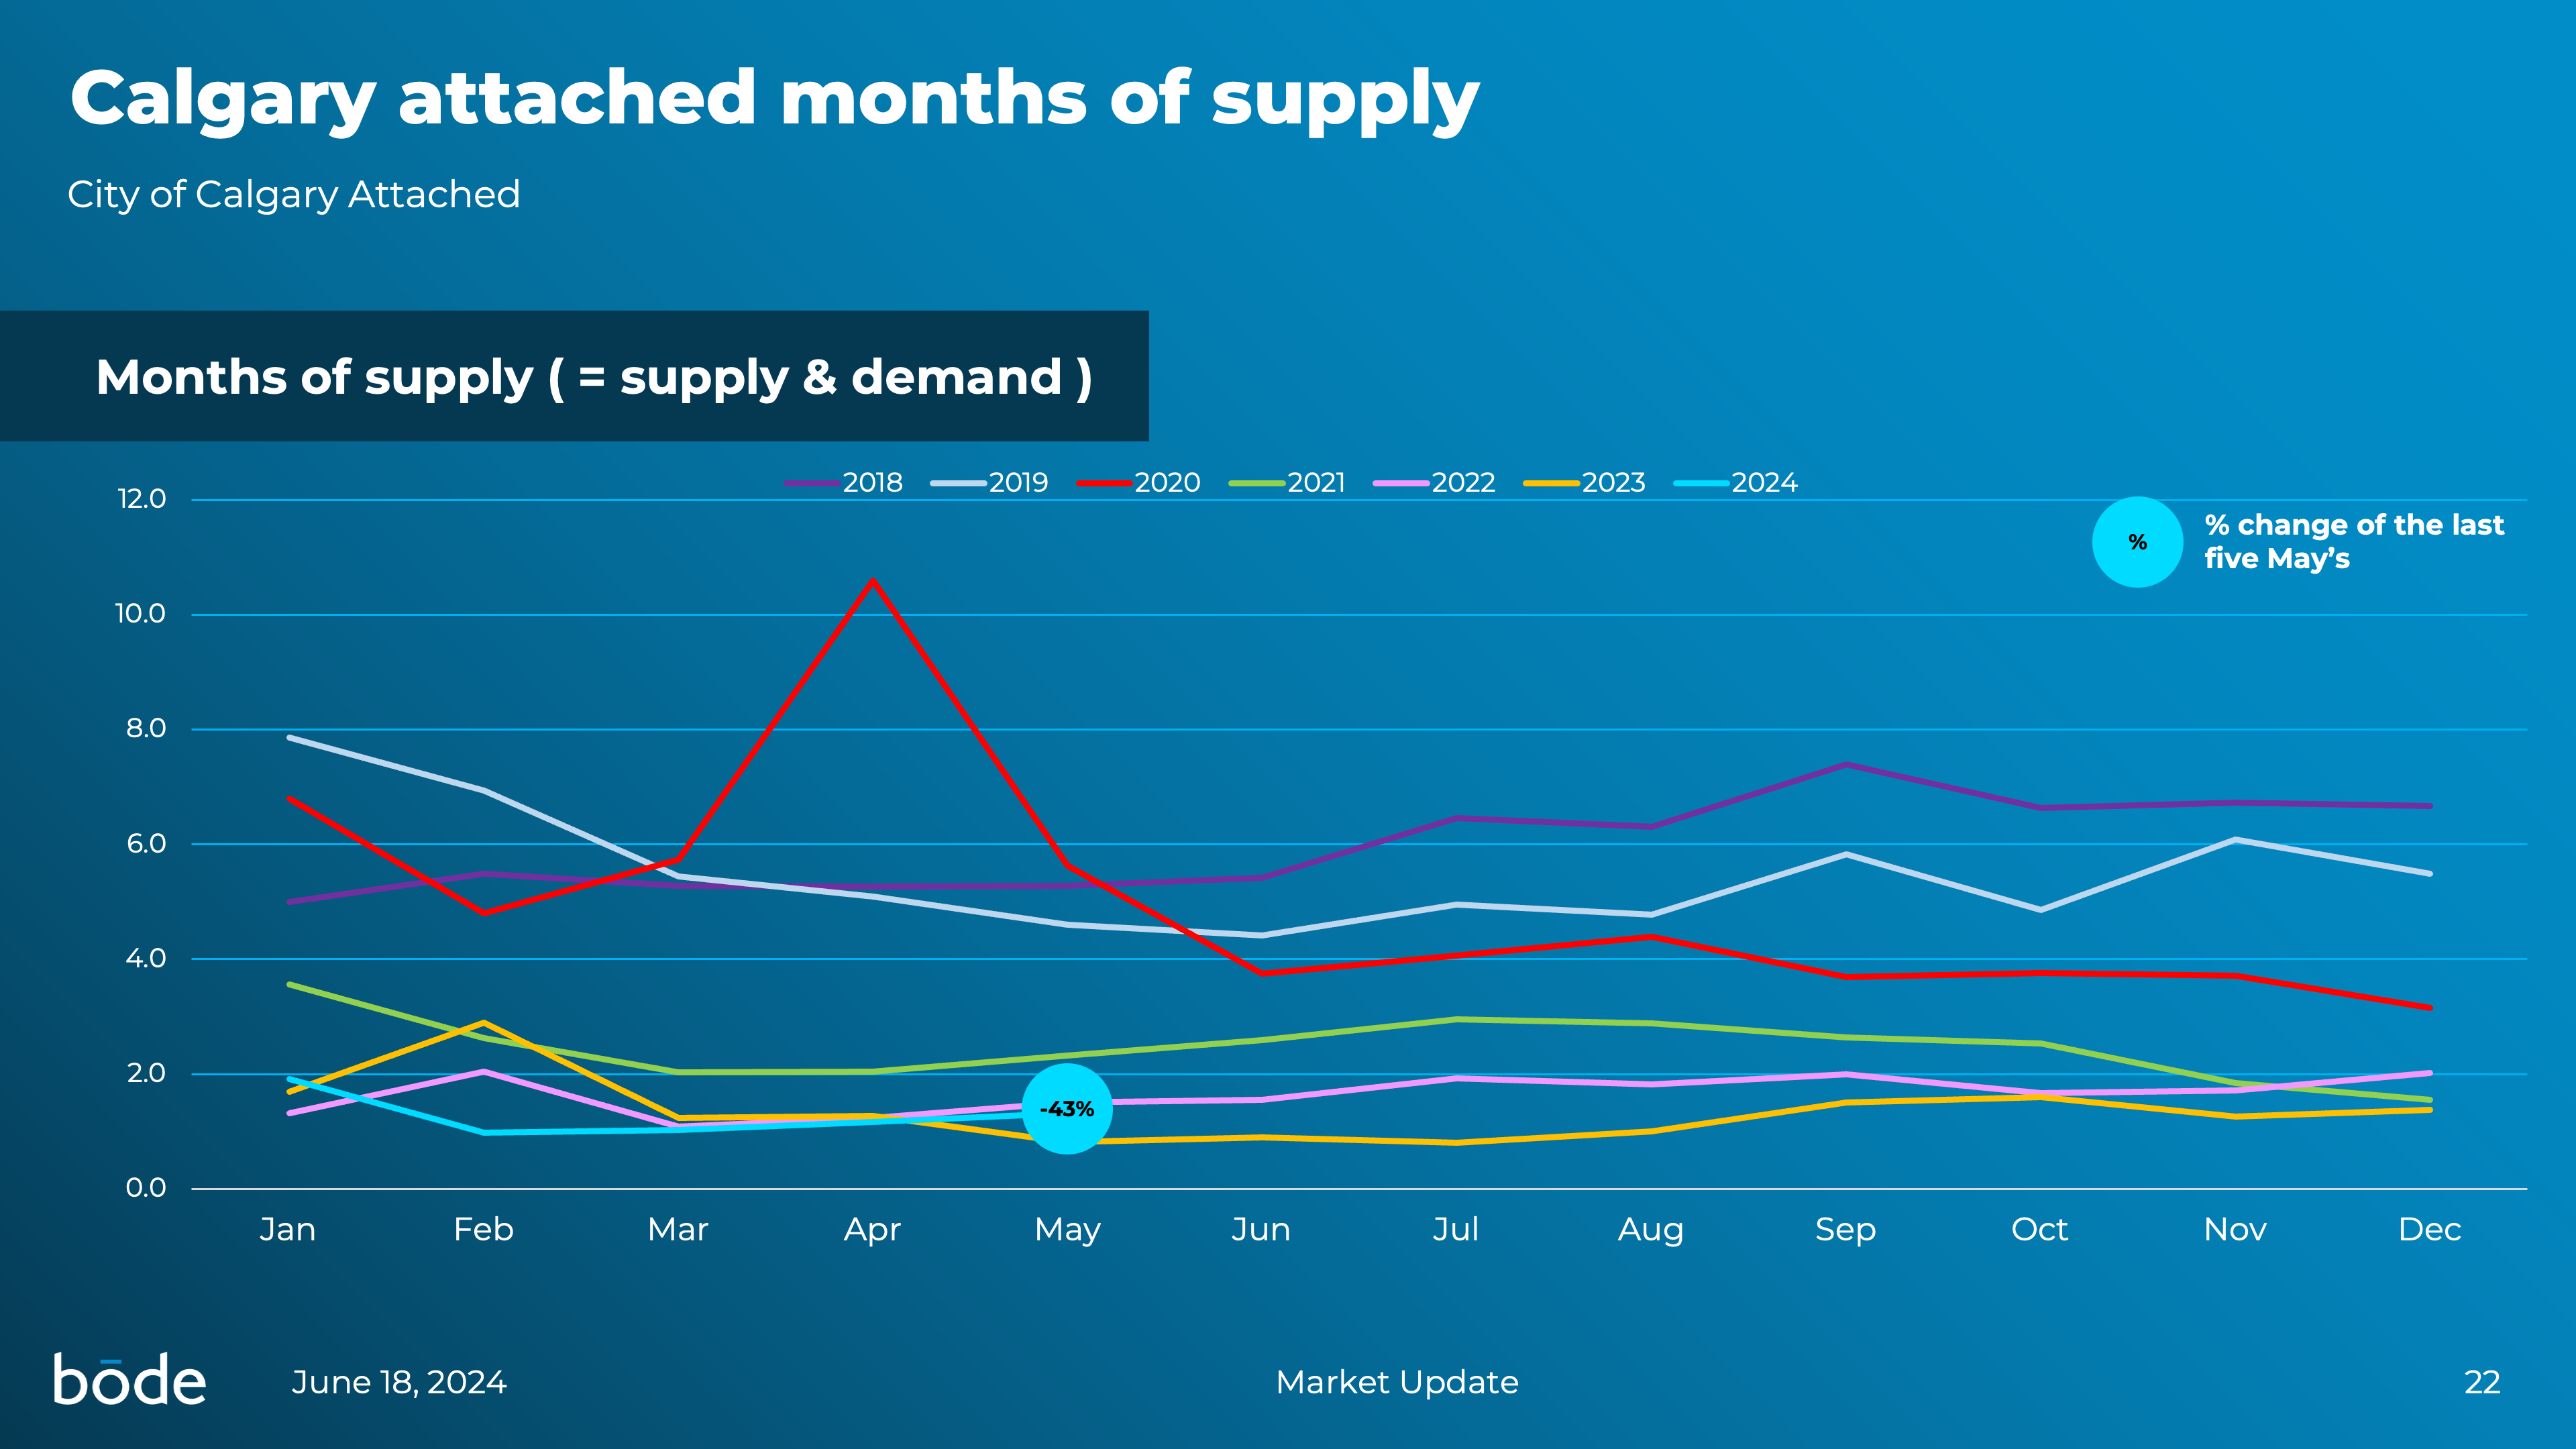
Months of Supply (i.e. the number of months it would take to sell all current inventory at the current rate of sale)
These metrics are the best indicators of the health of the real estate market. Let’s look at what they show us.
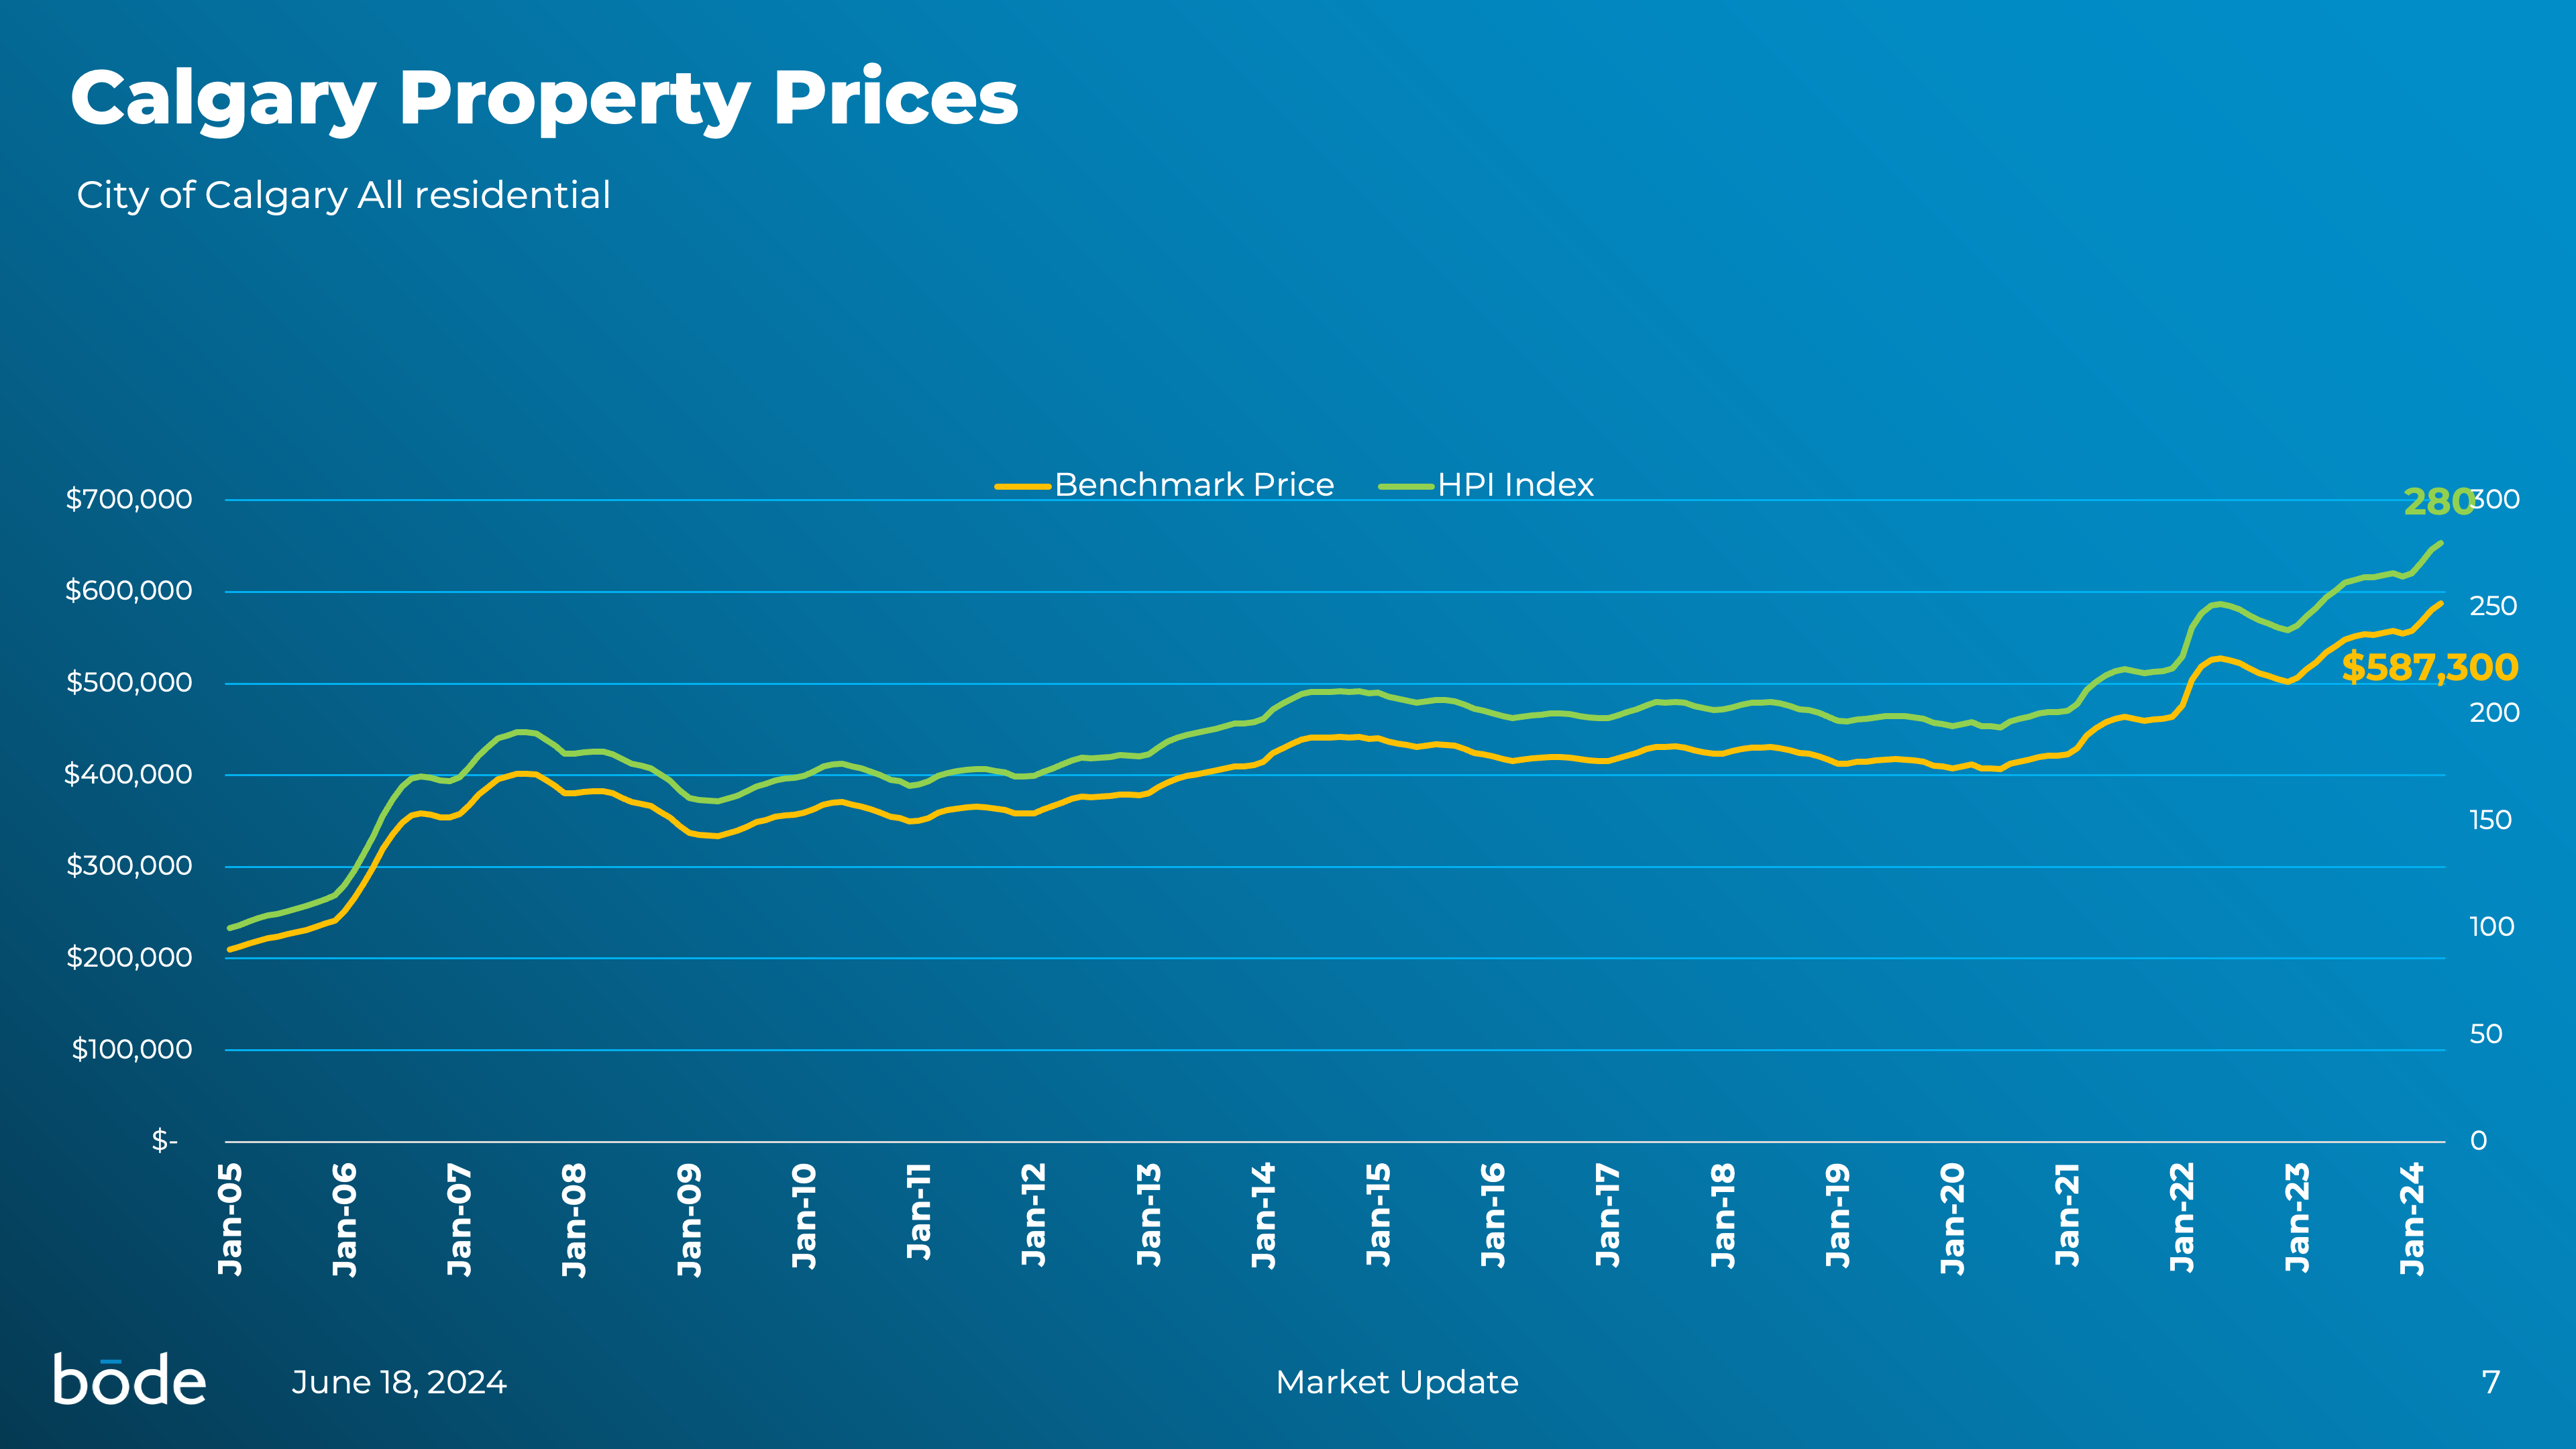
It’s fascinating to observe the dynamics of the Calgary housing market over the past five Mays. We’ve seen a notable 12% increase in listings, signaling a more active market where more homes are becoming available. Even more impressive is the 16% surge in sales, reflecting a robust demand that continues to outpace supply. Speaking of supply, inventory has plummeted by a staggering 31%, and the months of supply has been cut by more than half, down 53%. Despite these tight conditions, prices have remained on an upward trajectory, with a modest 1.2% rise month over month and a substantial 9.9% increase year over year. This combination of factors paints a compelling picture of a market that is both vibrant and competitive.
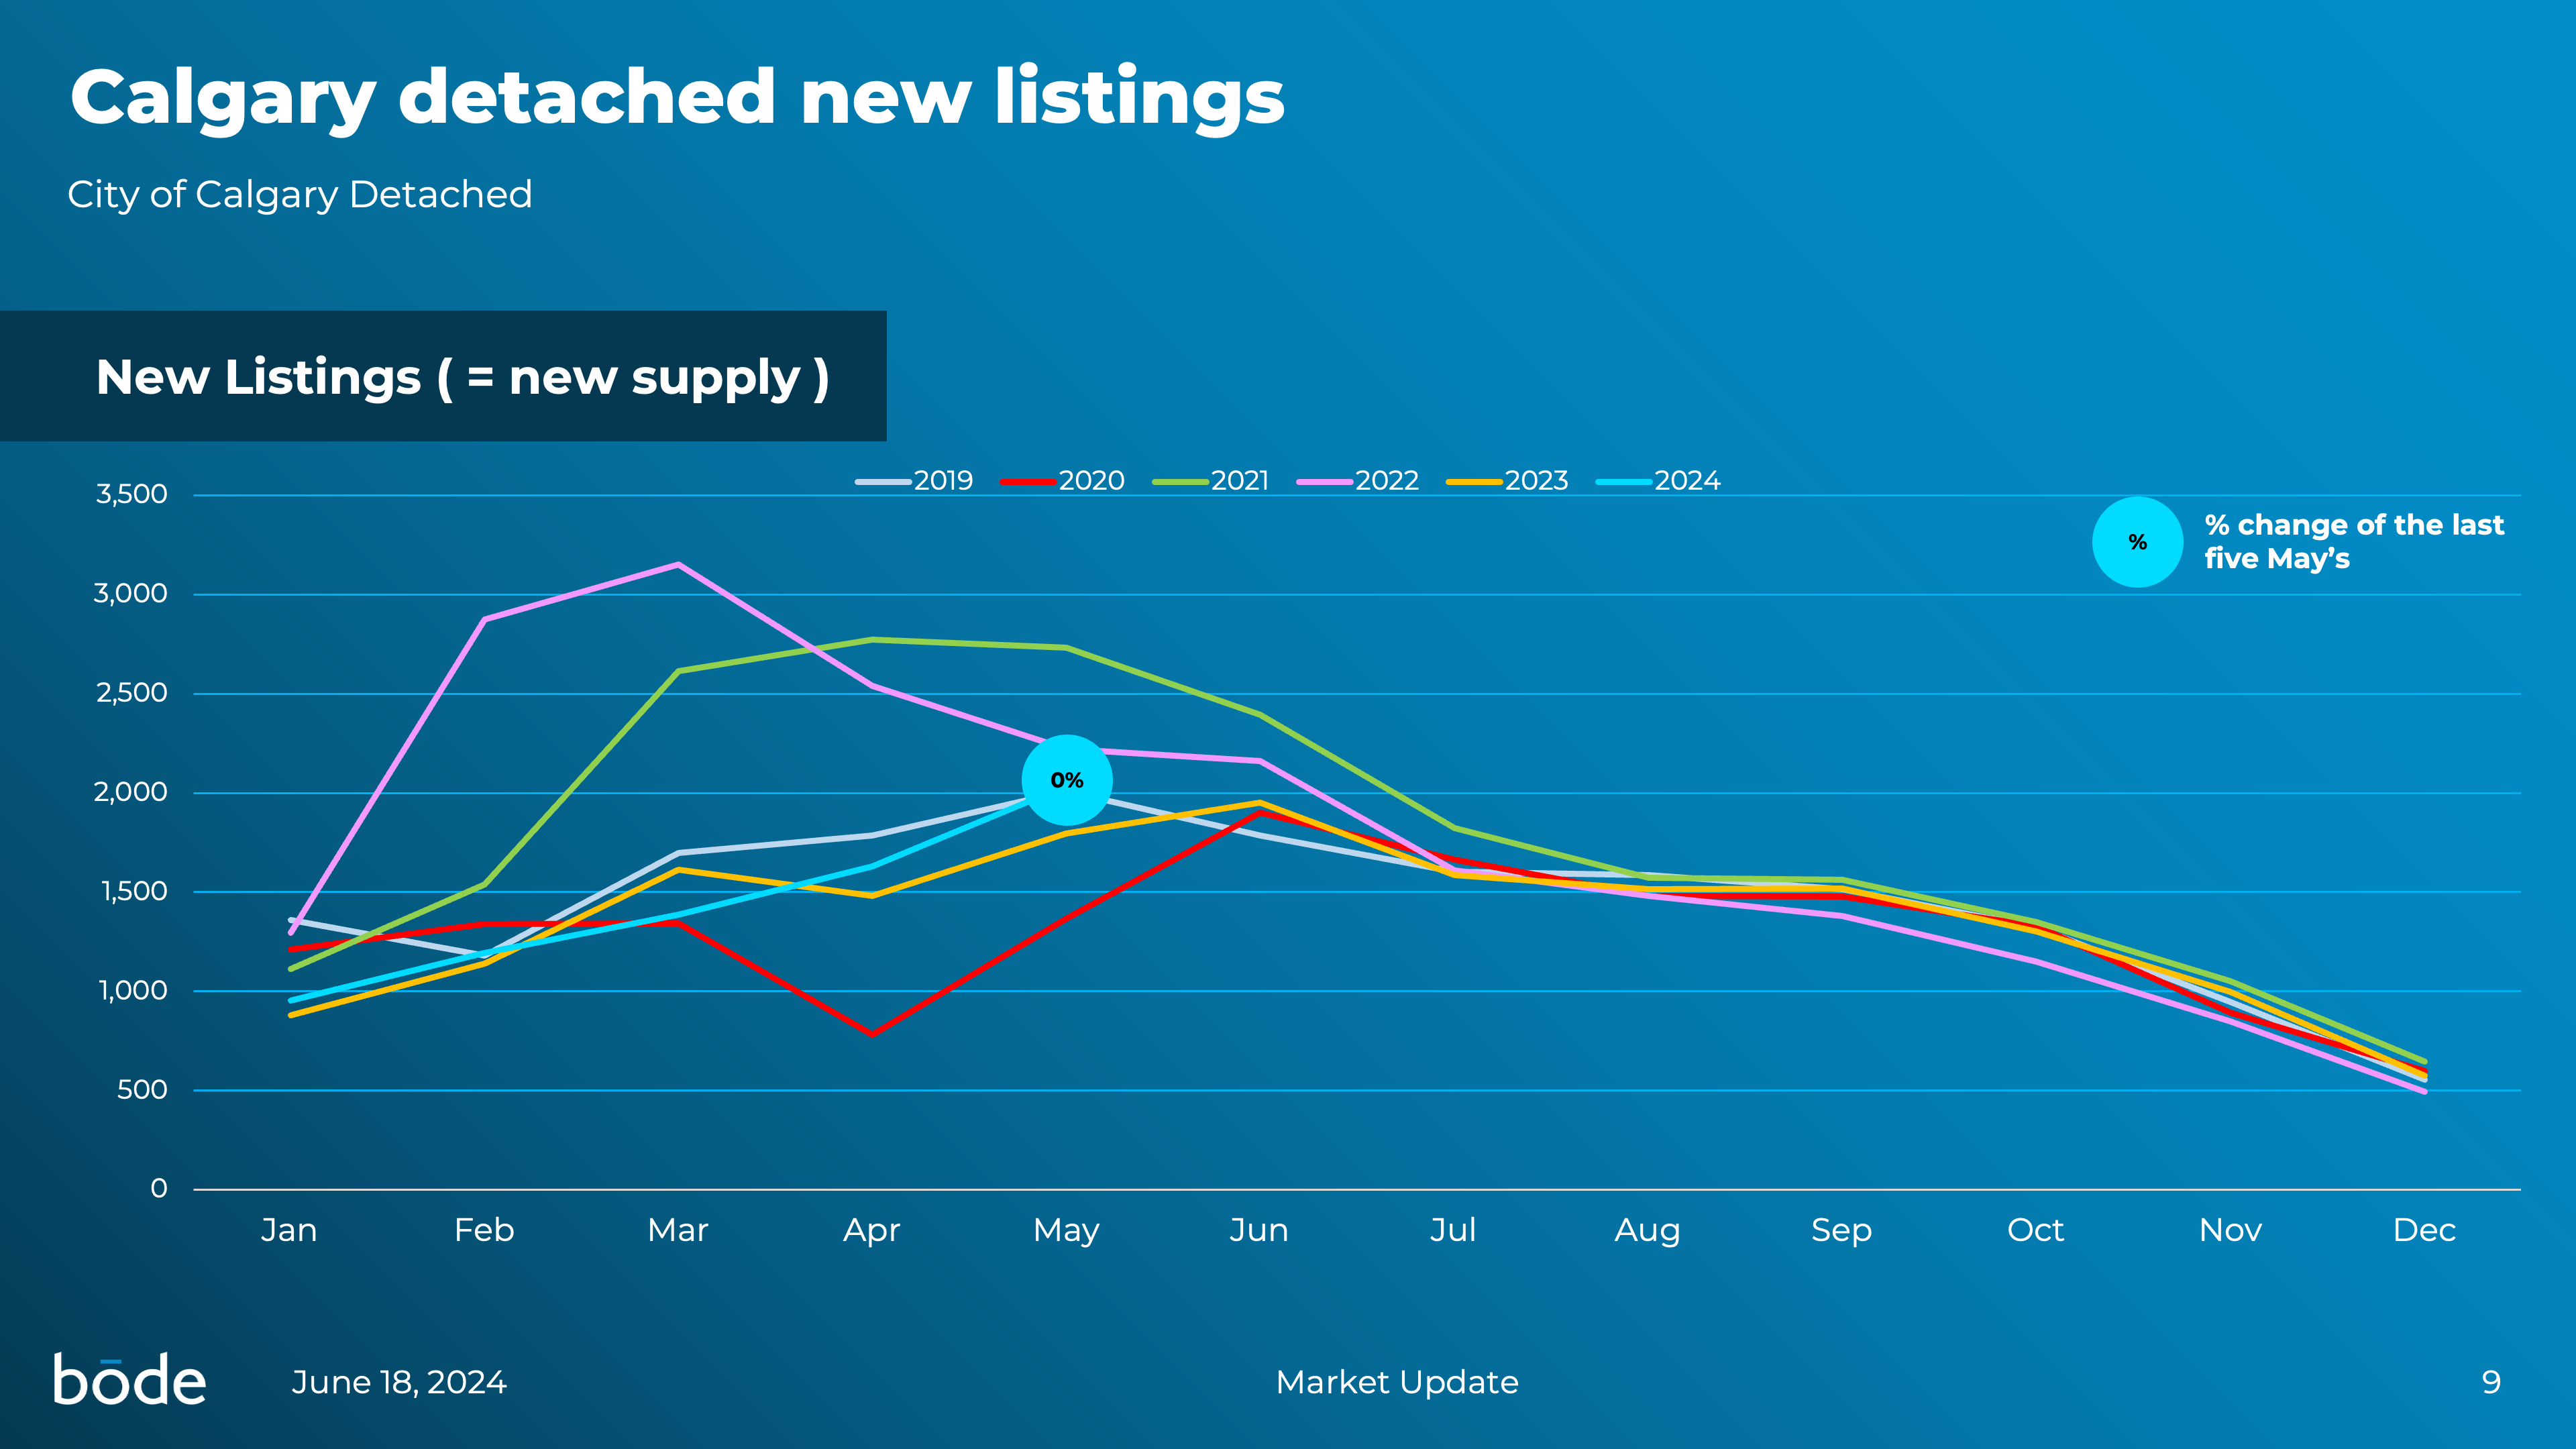
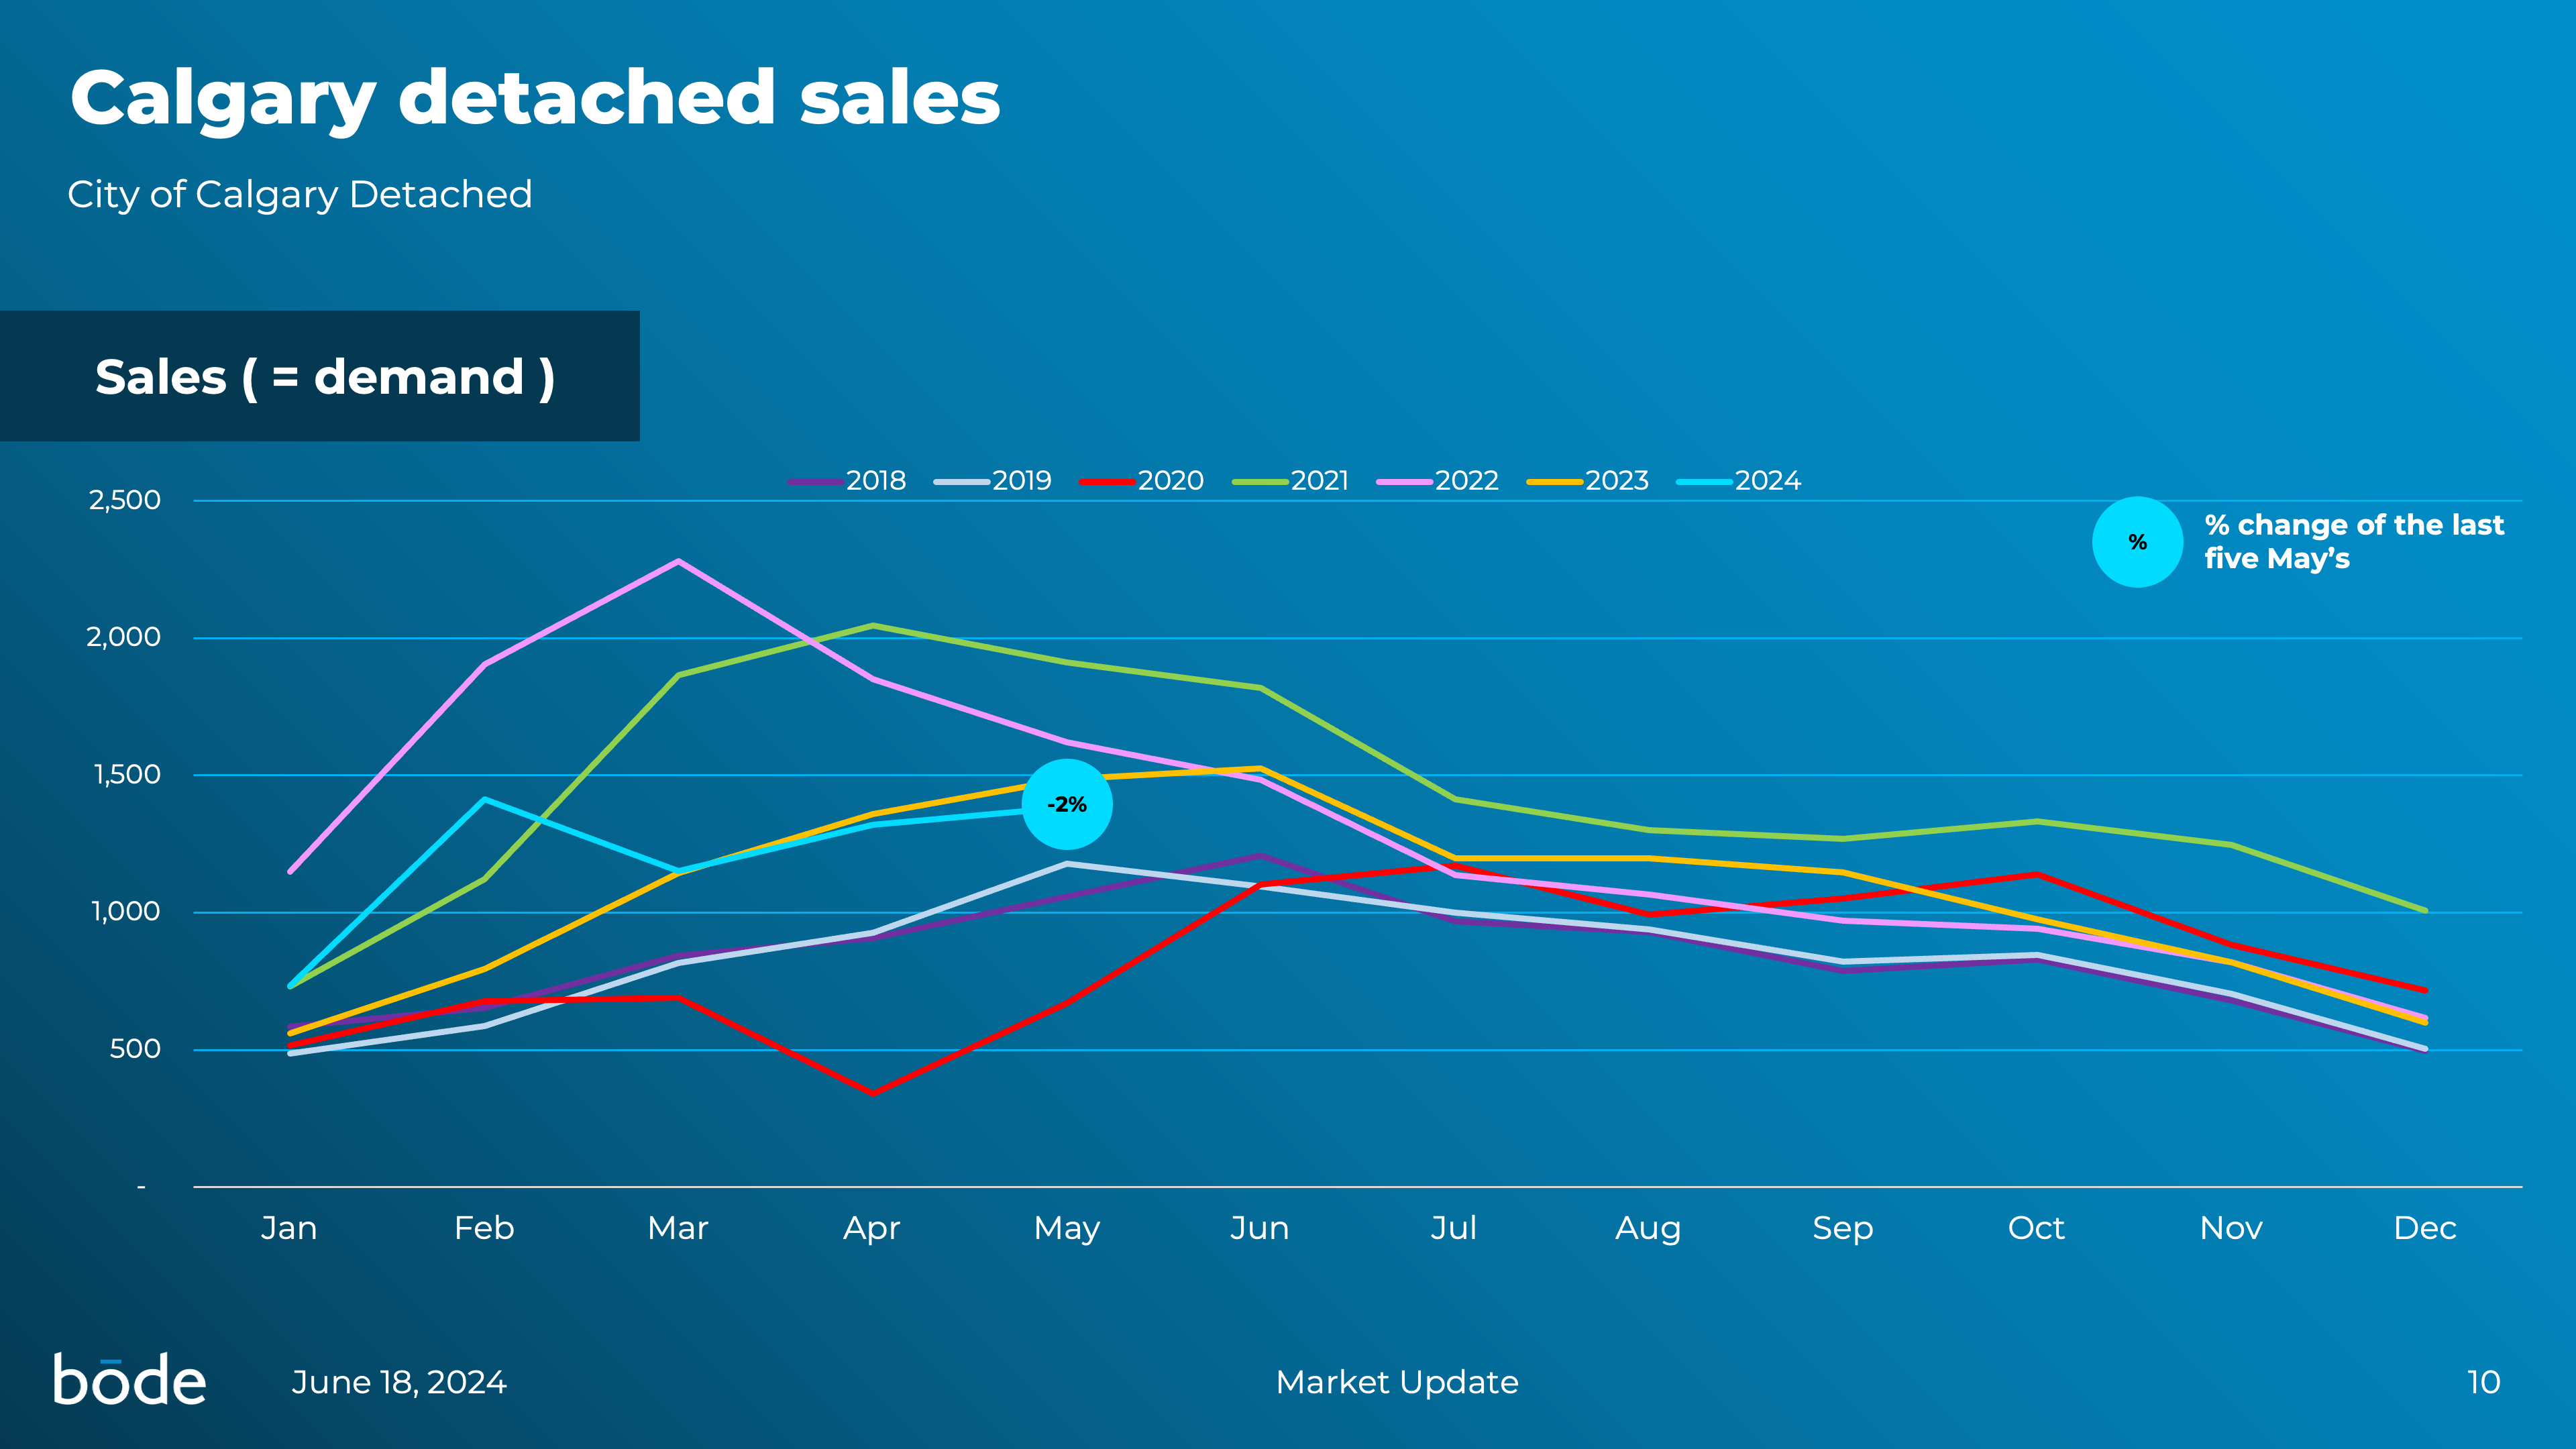
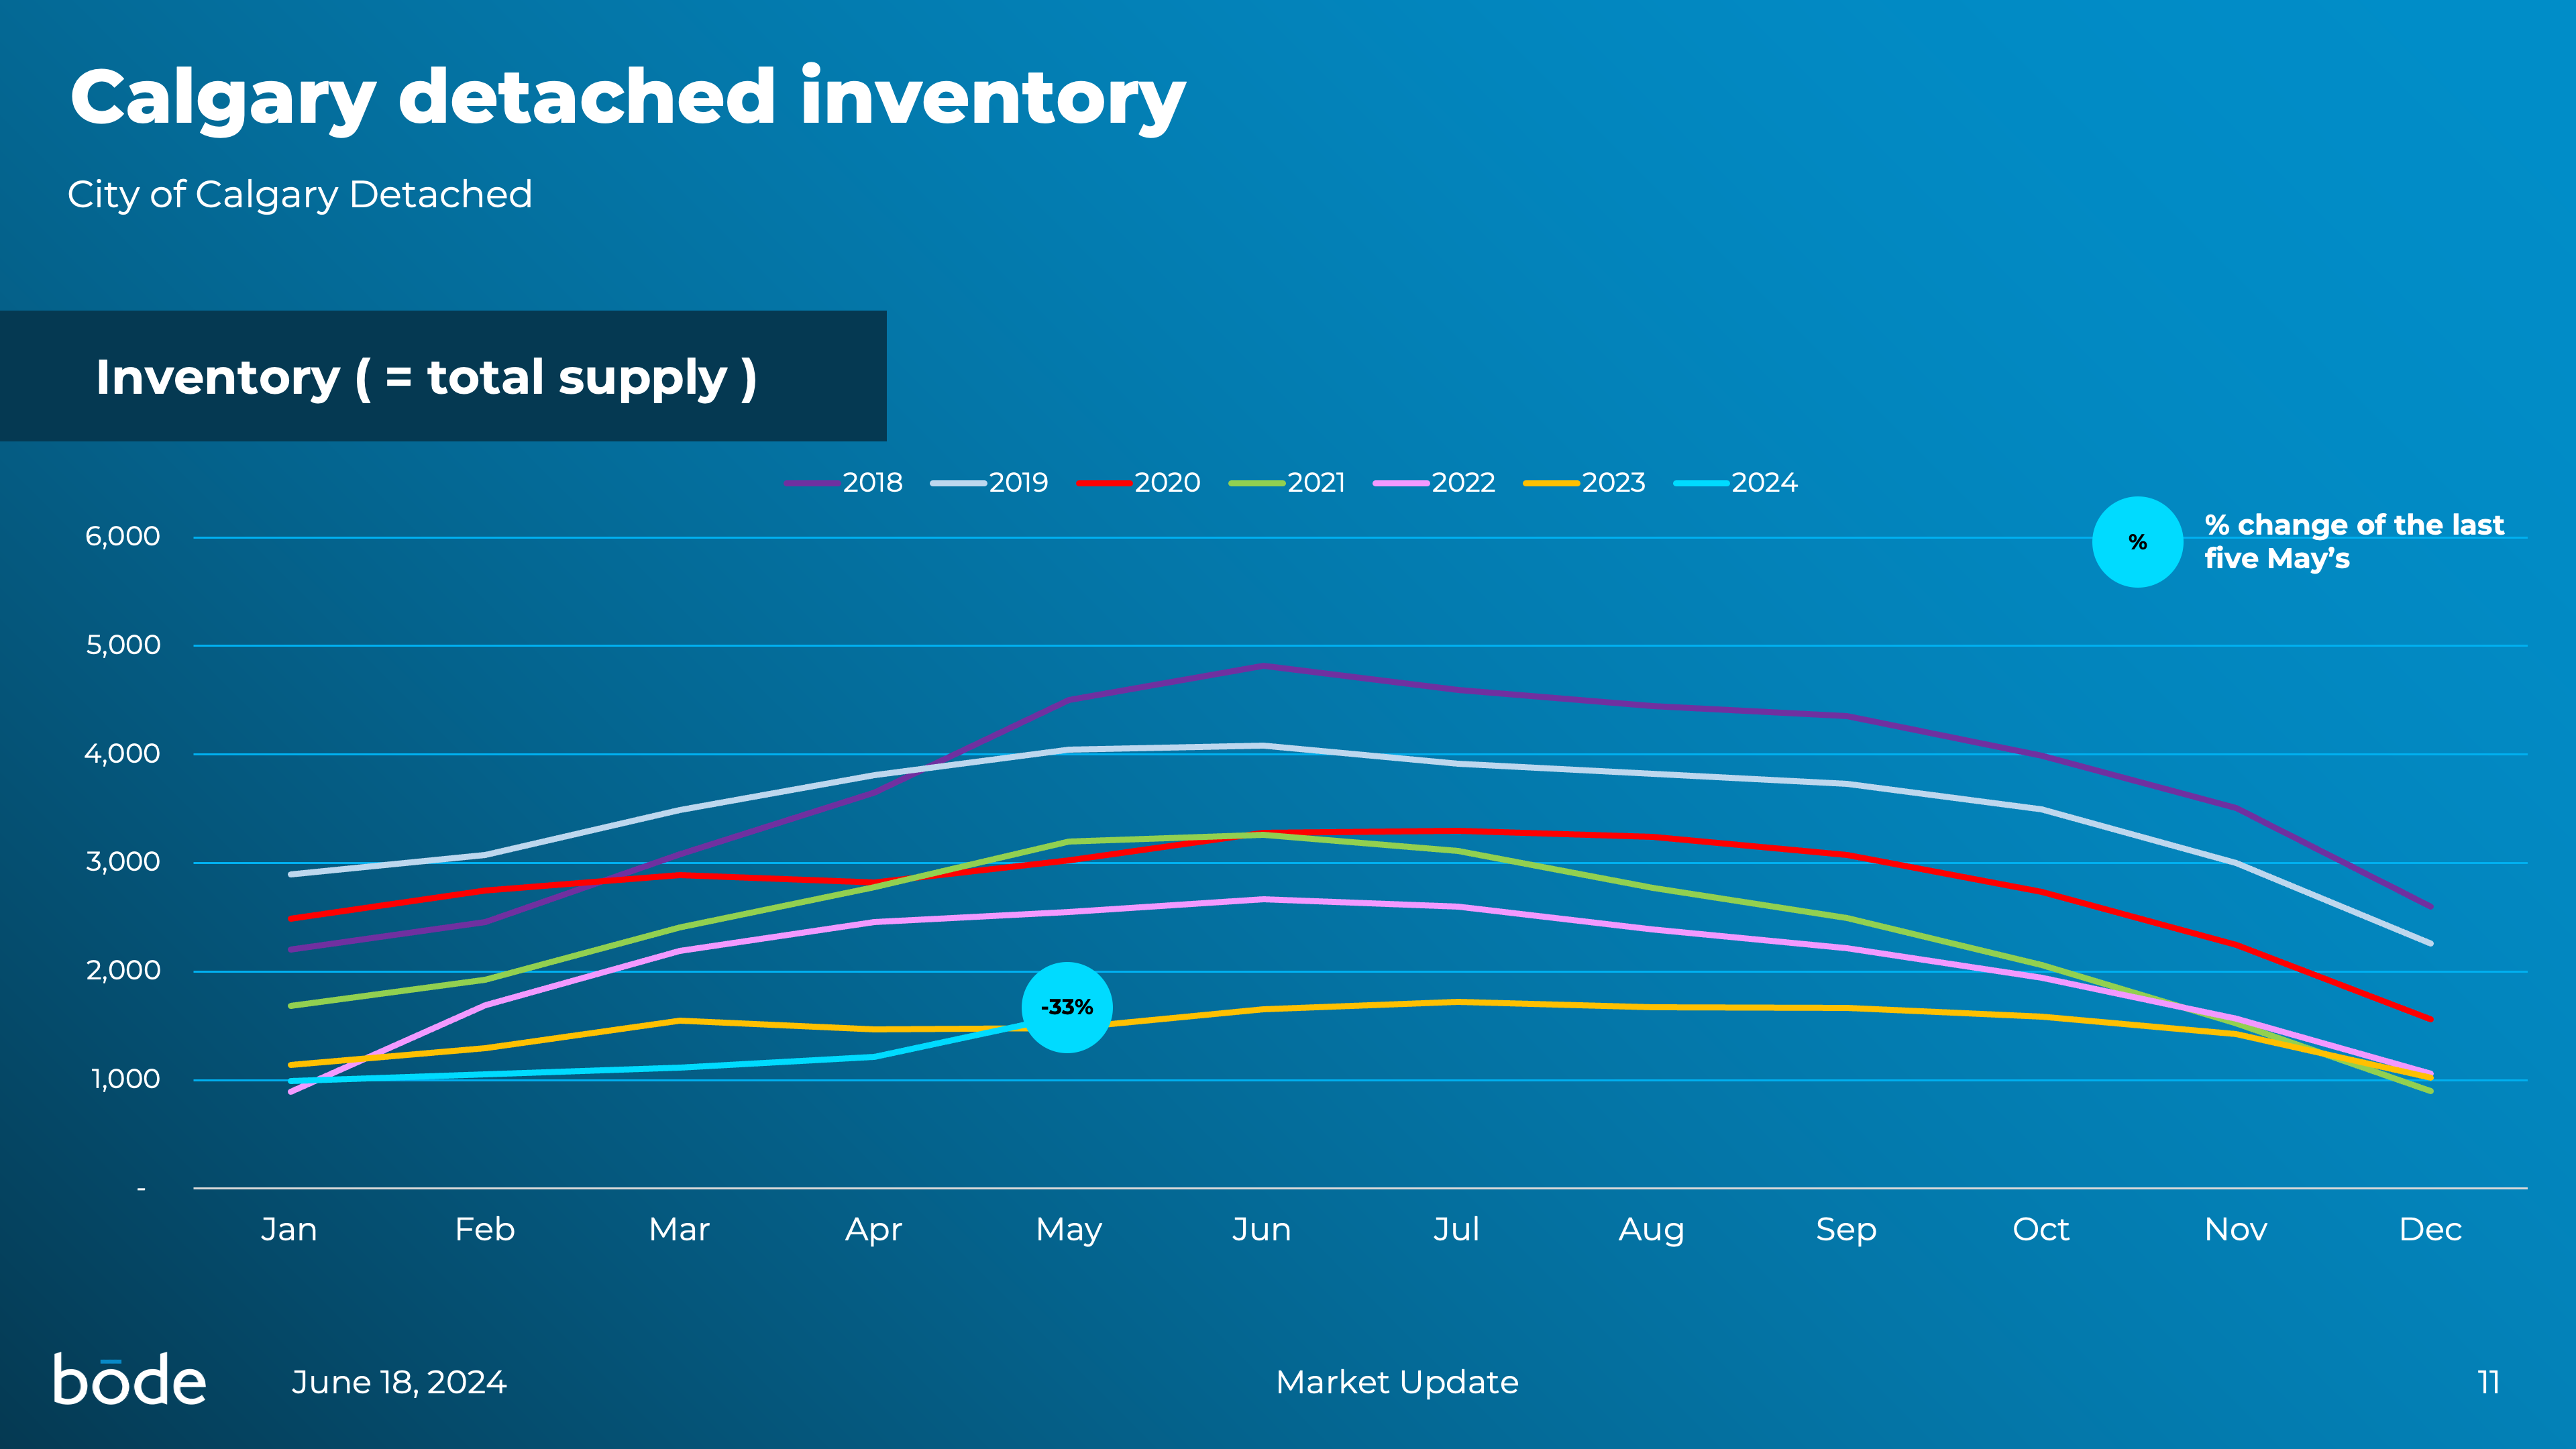
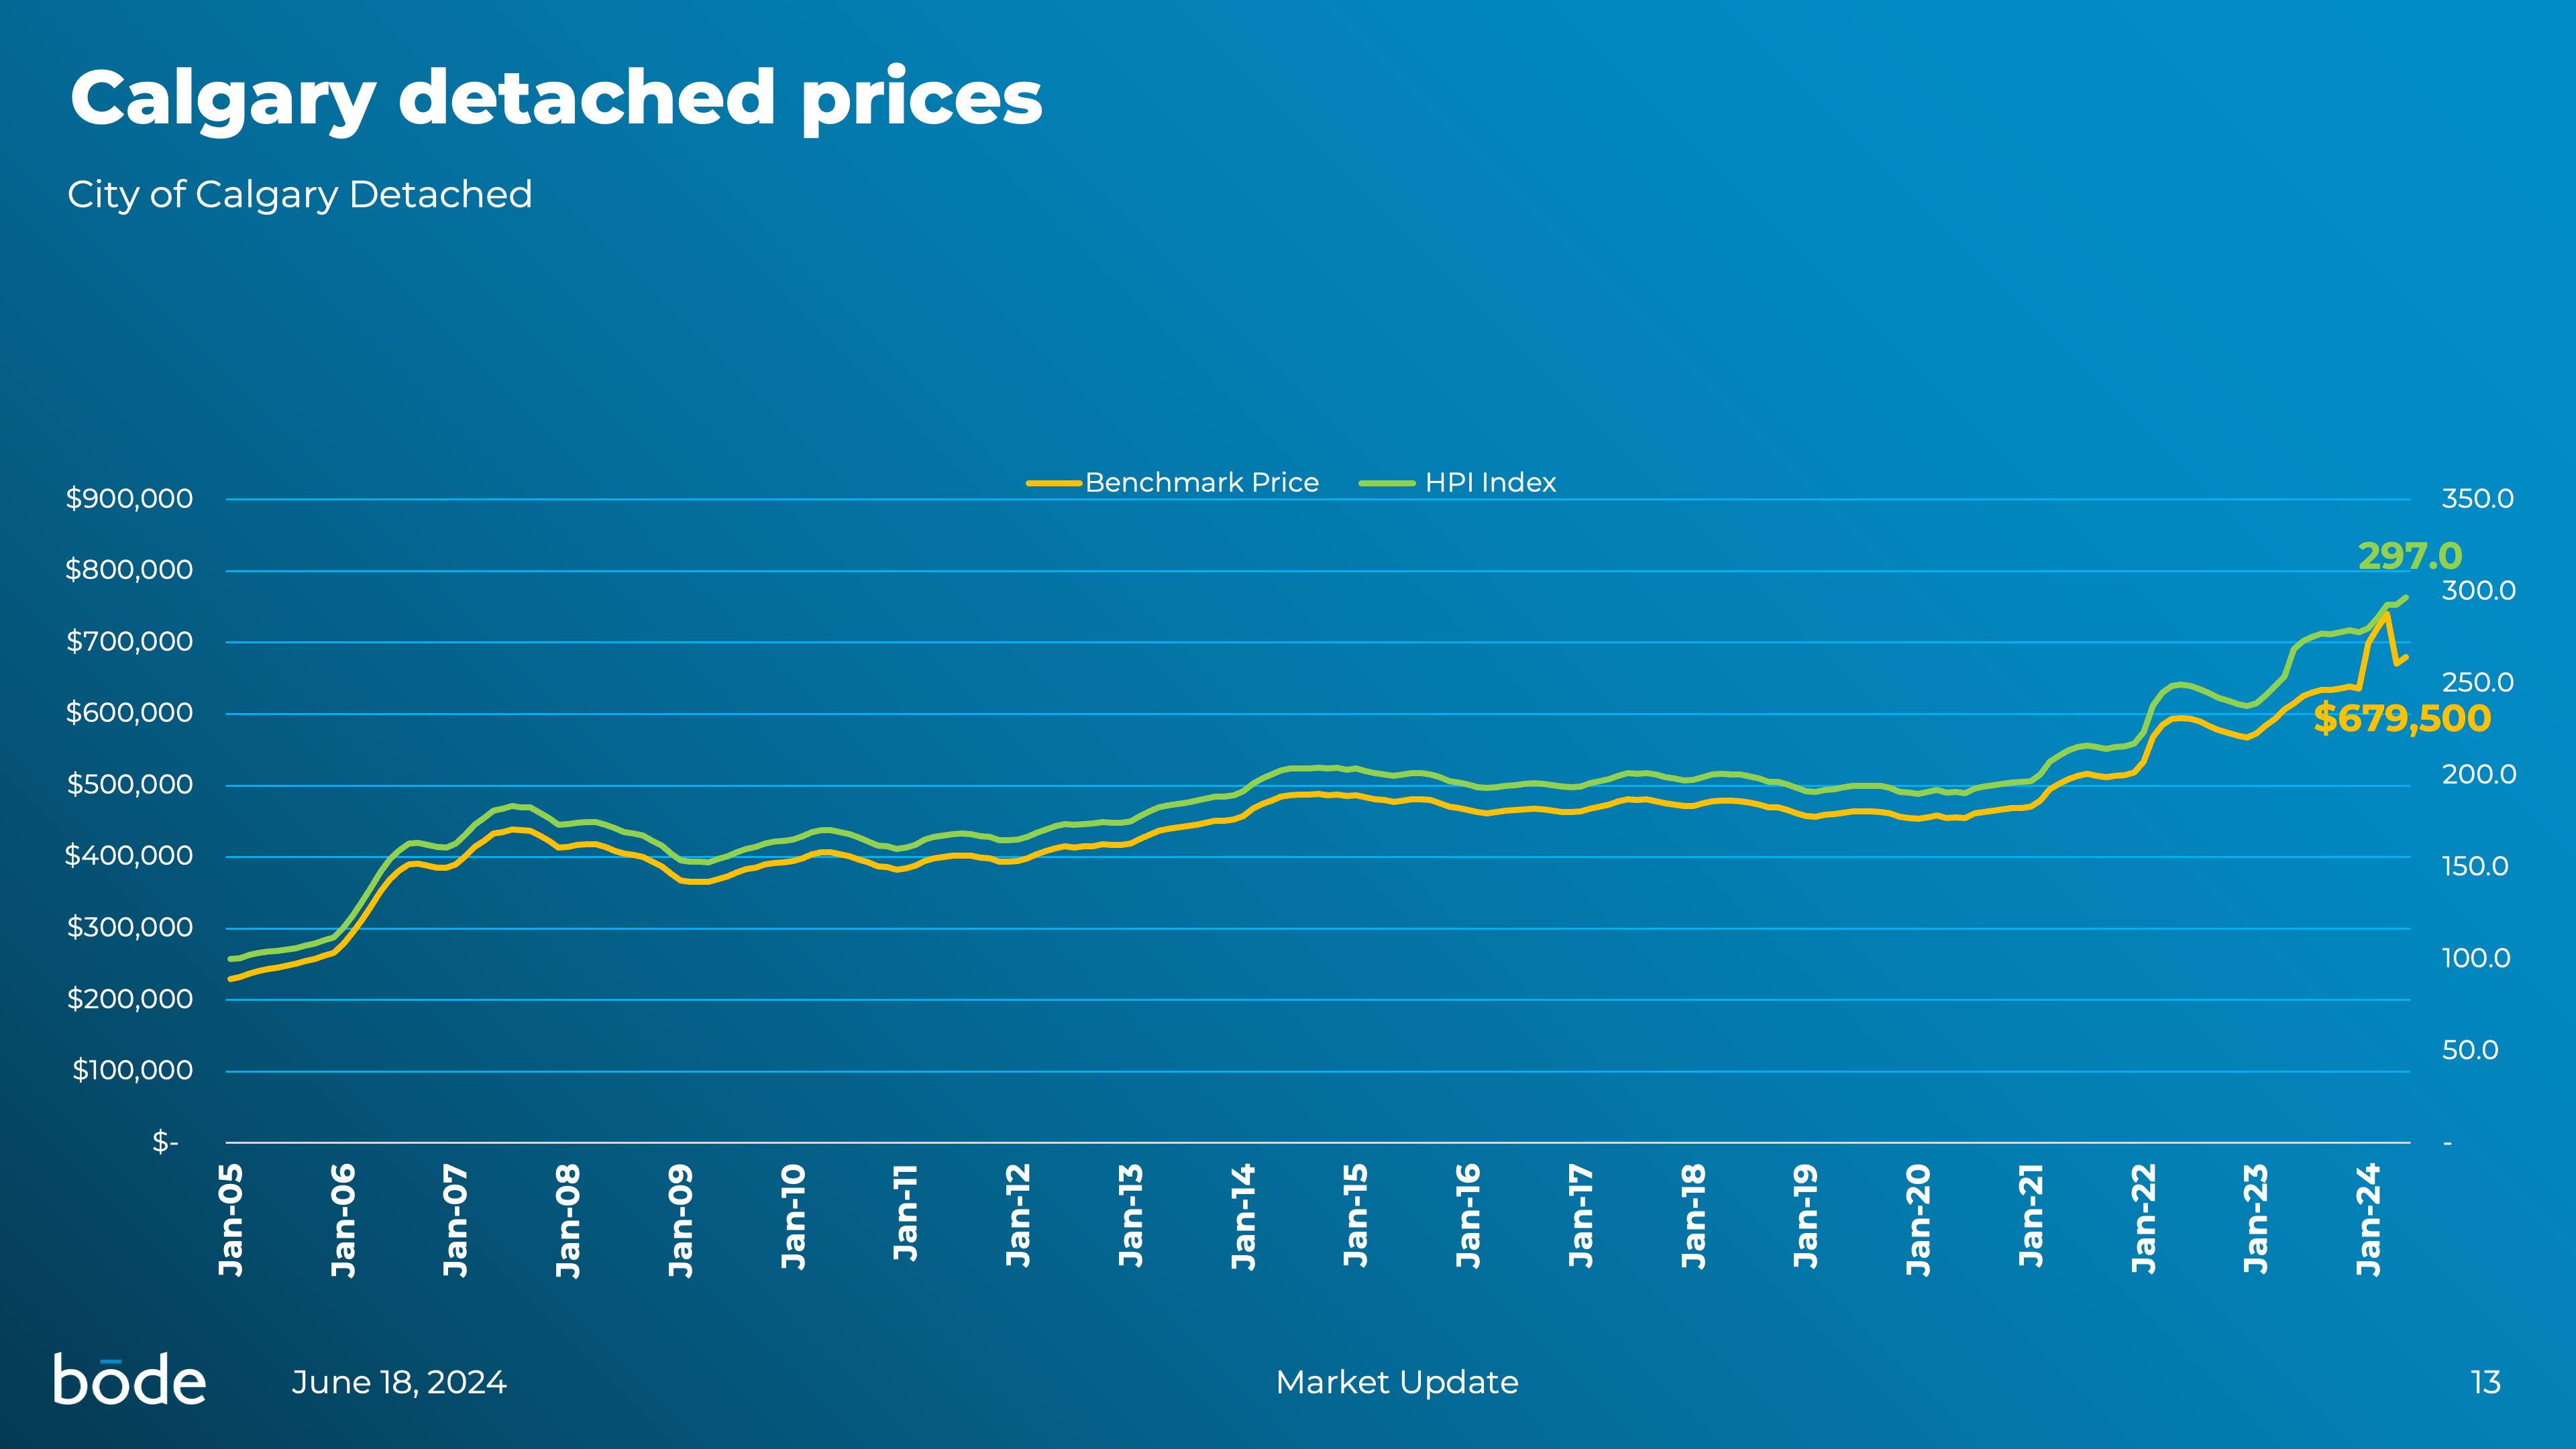
Calgary's Detached Homes
Reflecting on Calgary’s detached housing market over the past five Mays, it’s interesting to see that listings have held steady with no change, remaining at 0%. However, sales have dipped slightly by 2%, indicating a marginal cooling in buyer activity. Meanwhile, inventory has significantly contracted by 33%, and the months of supply have dropped by 42%, highlighting a tighter market environment. Despite these shifts, prices have continued to climb, with a 1% increase month over month and an impressive 10% rise year over year. These trends suggest a resilient market with ongoing demand, even amid fluctuating supply levels.
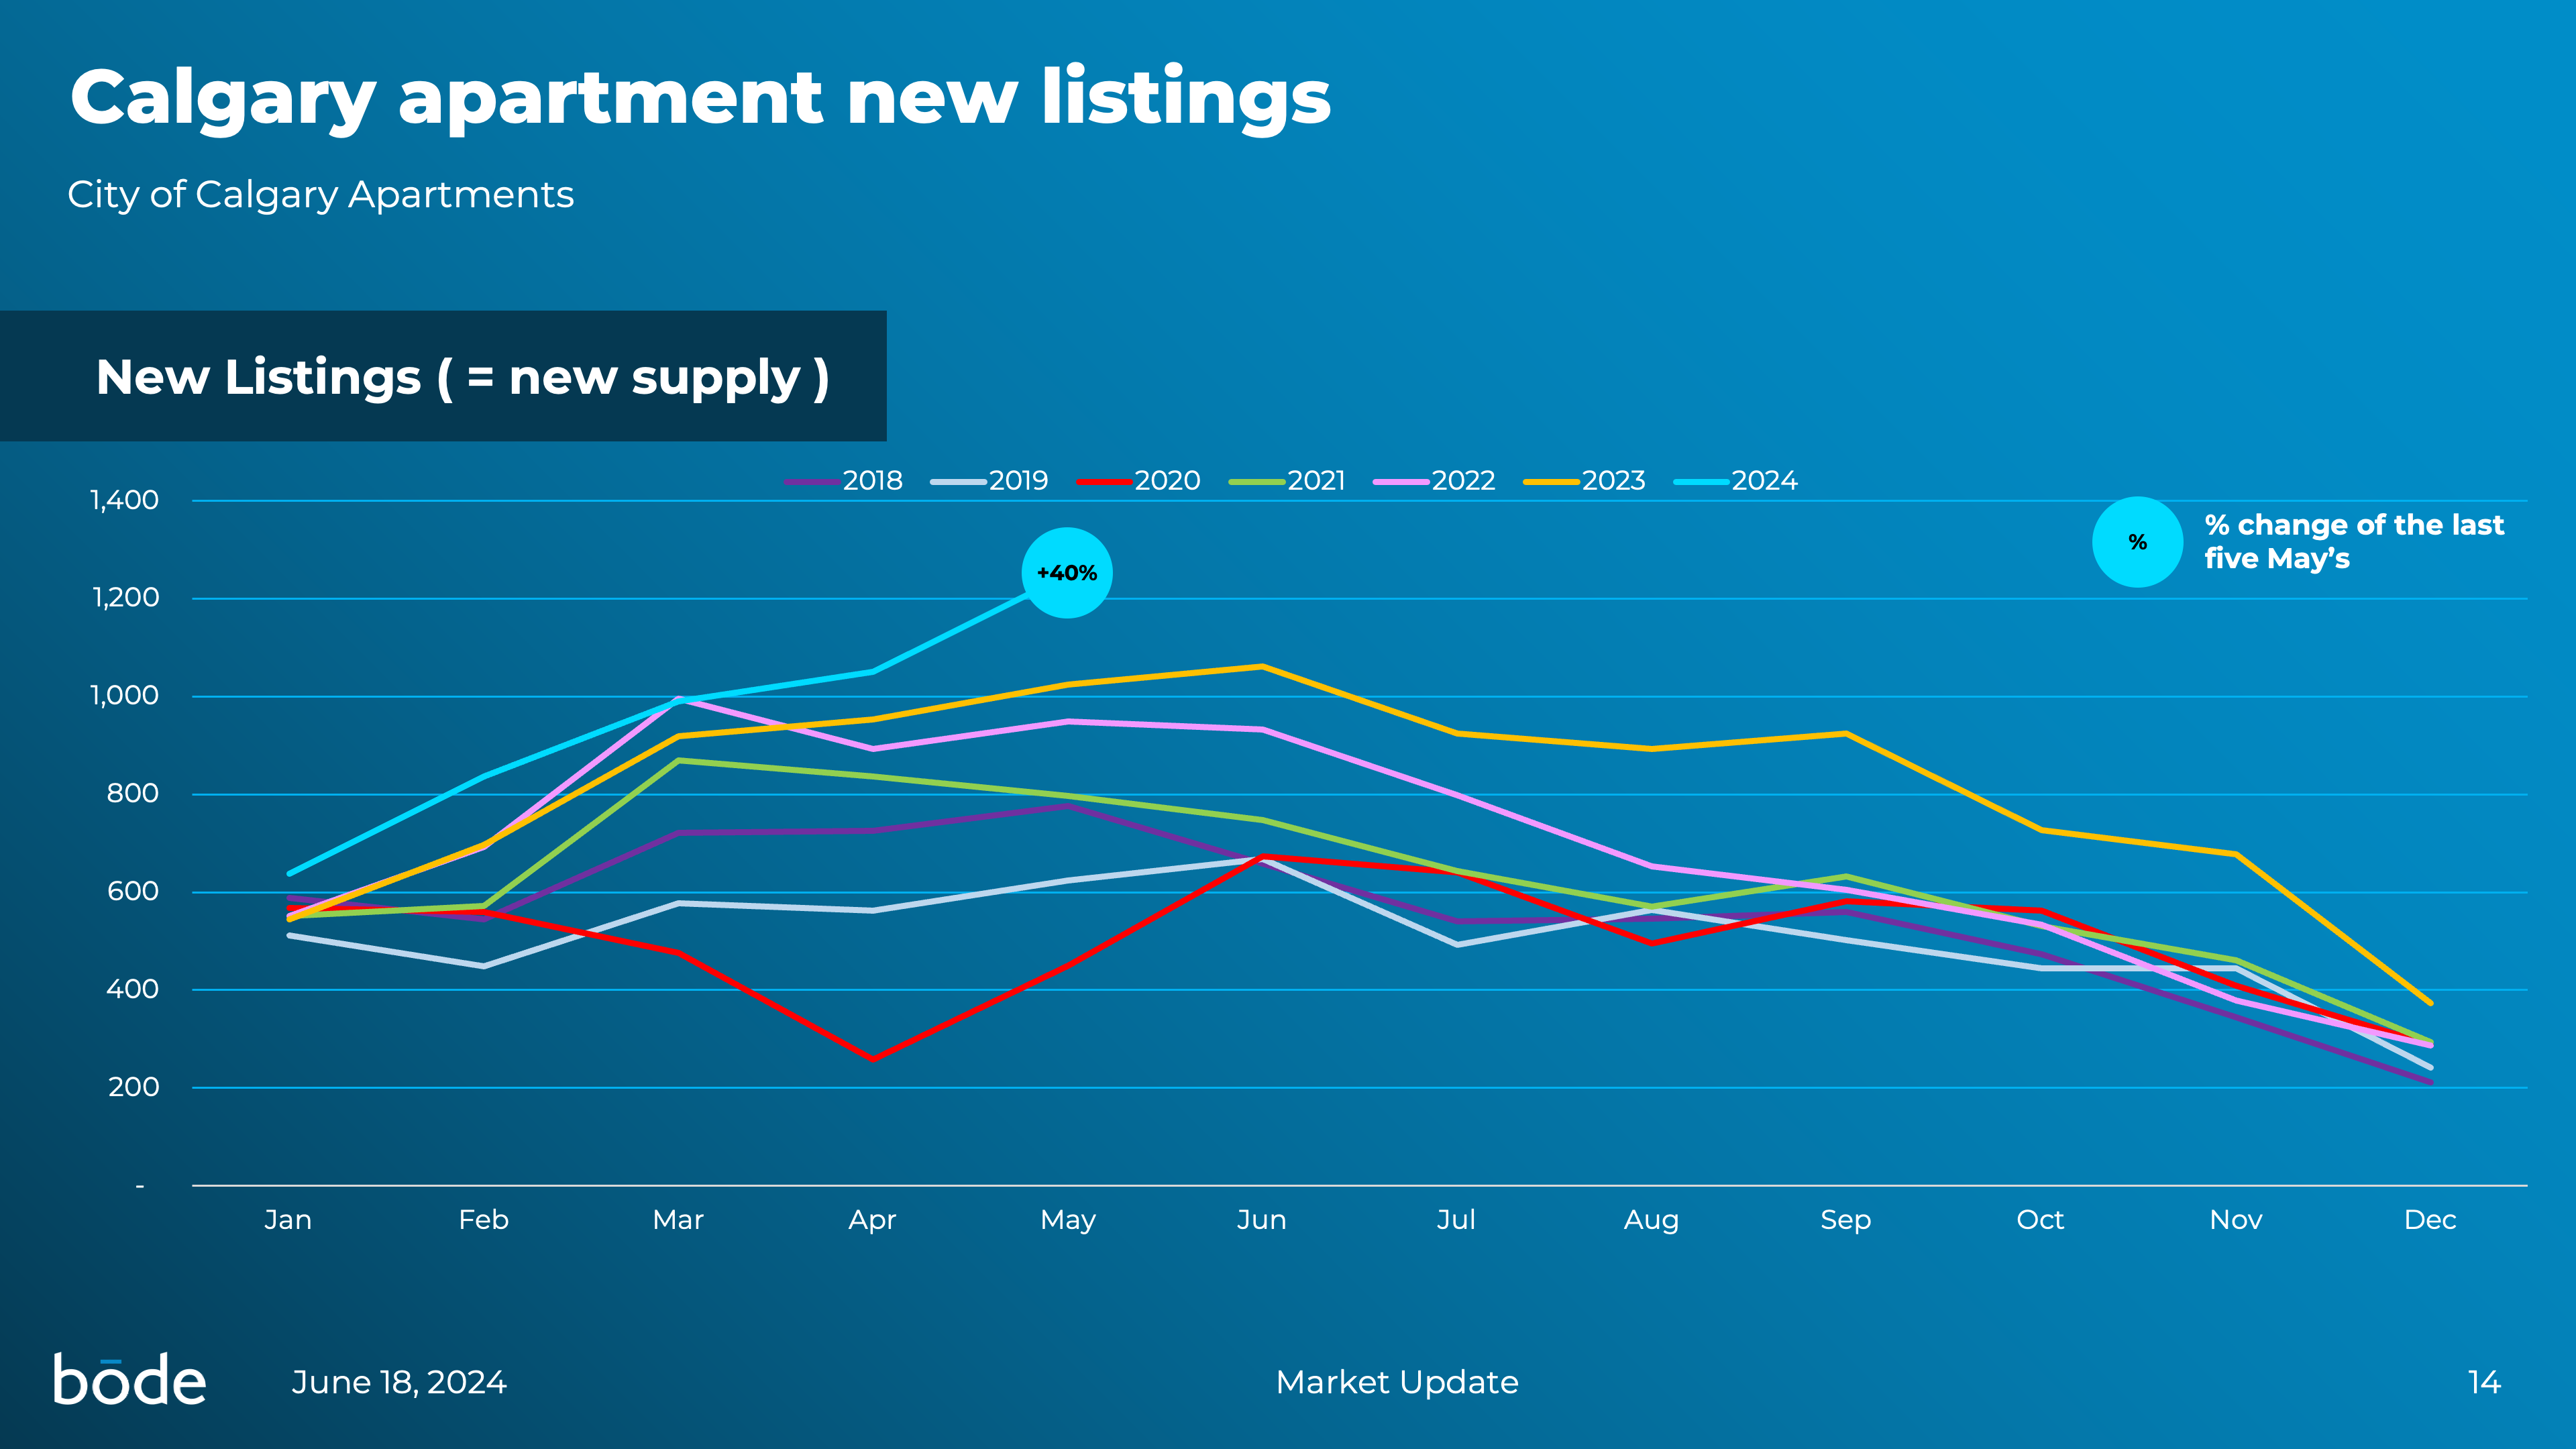
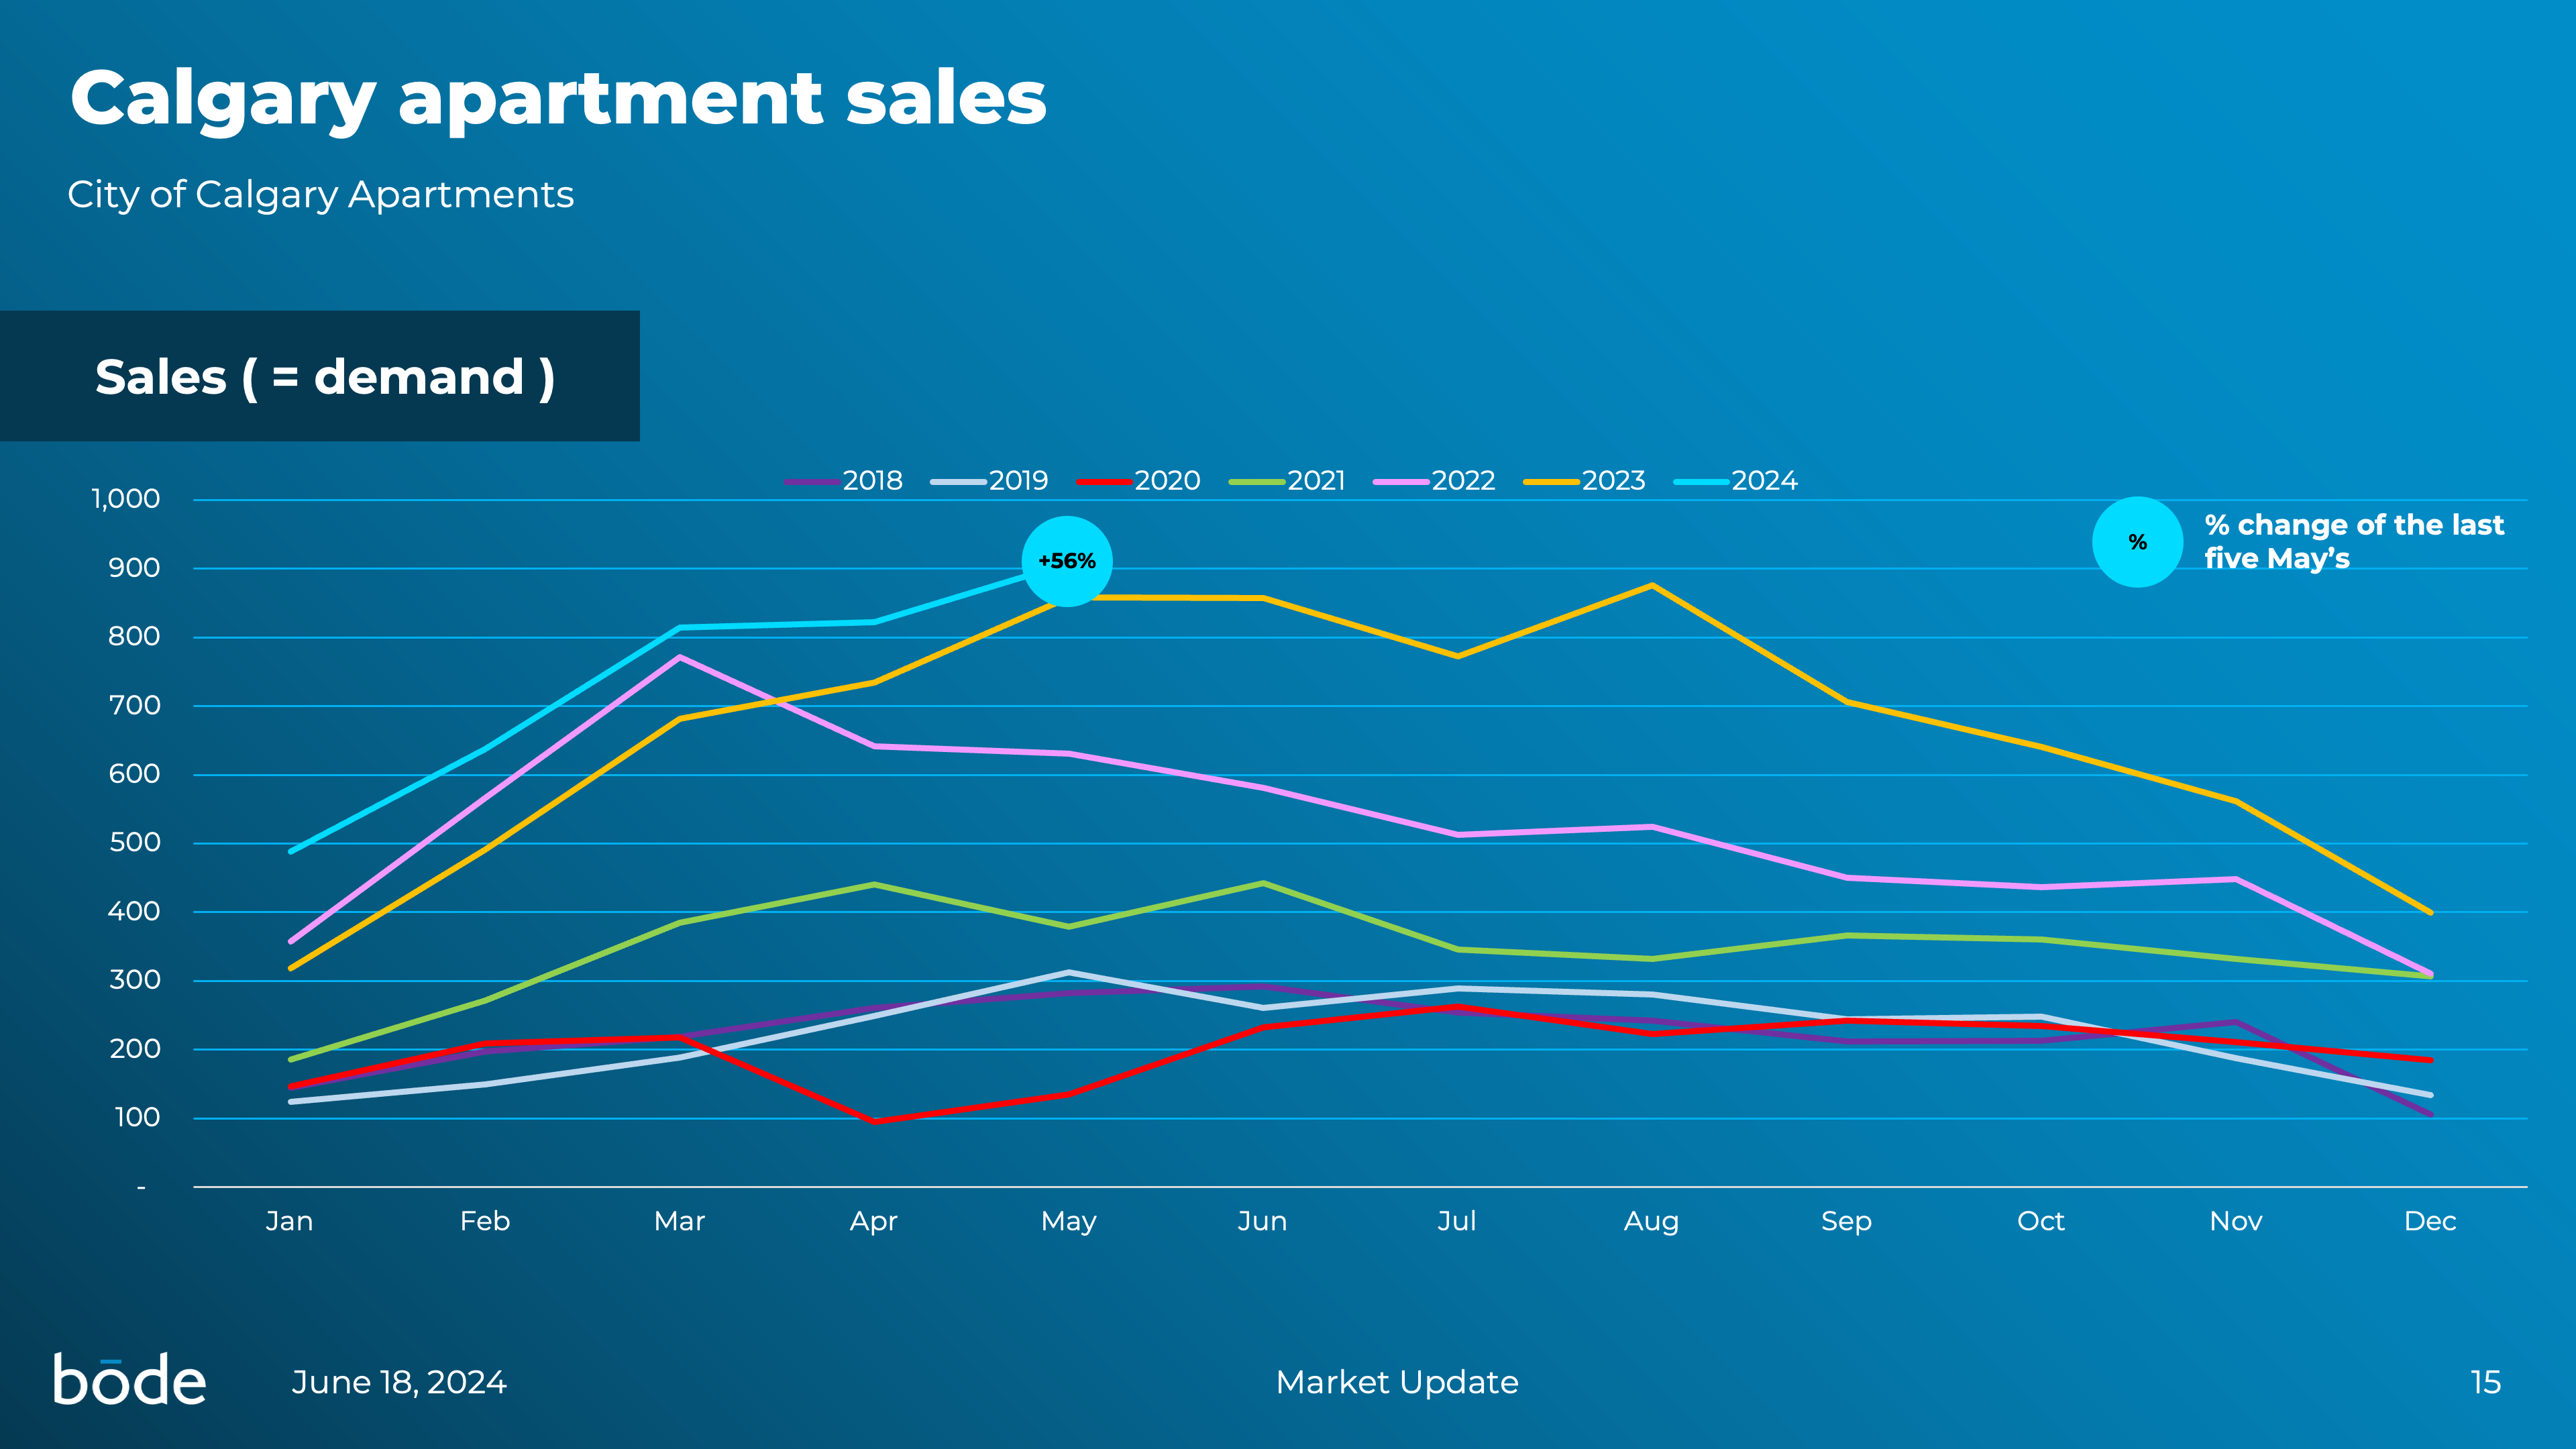
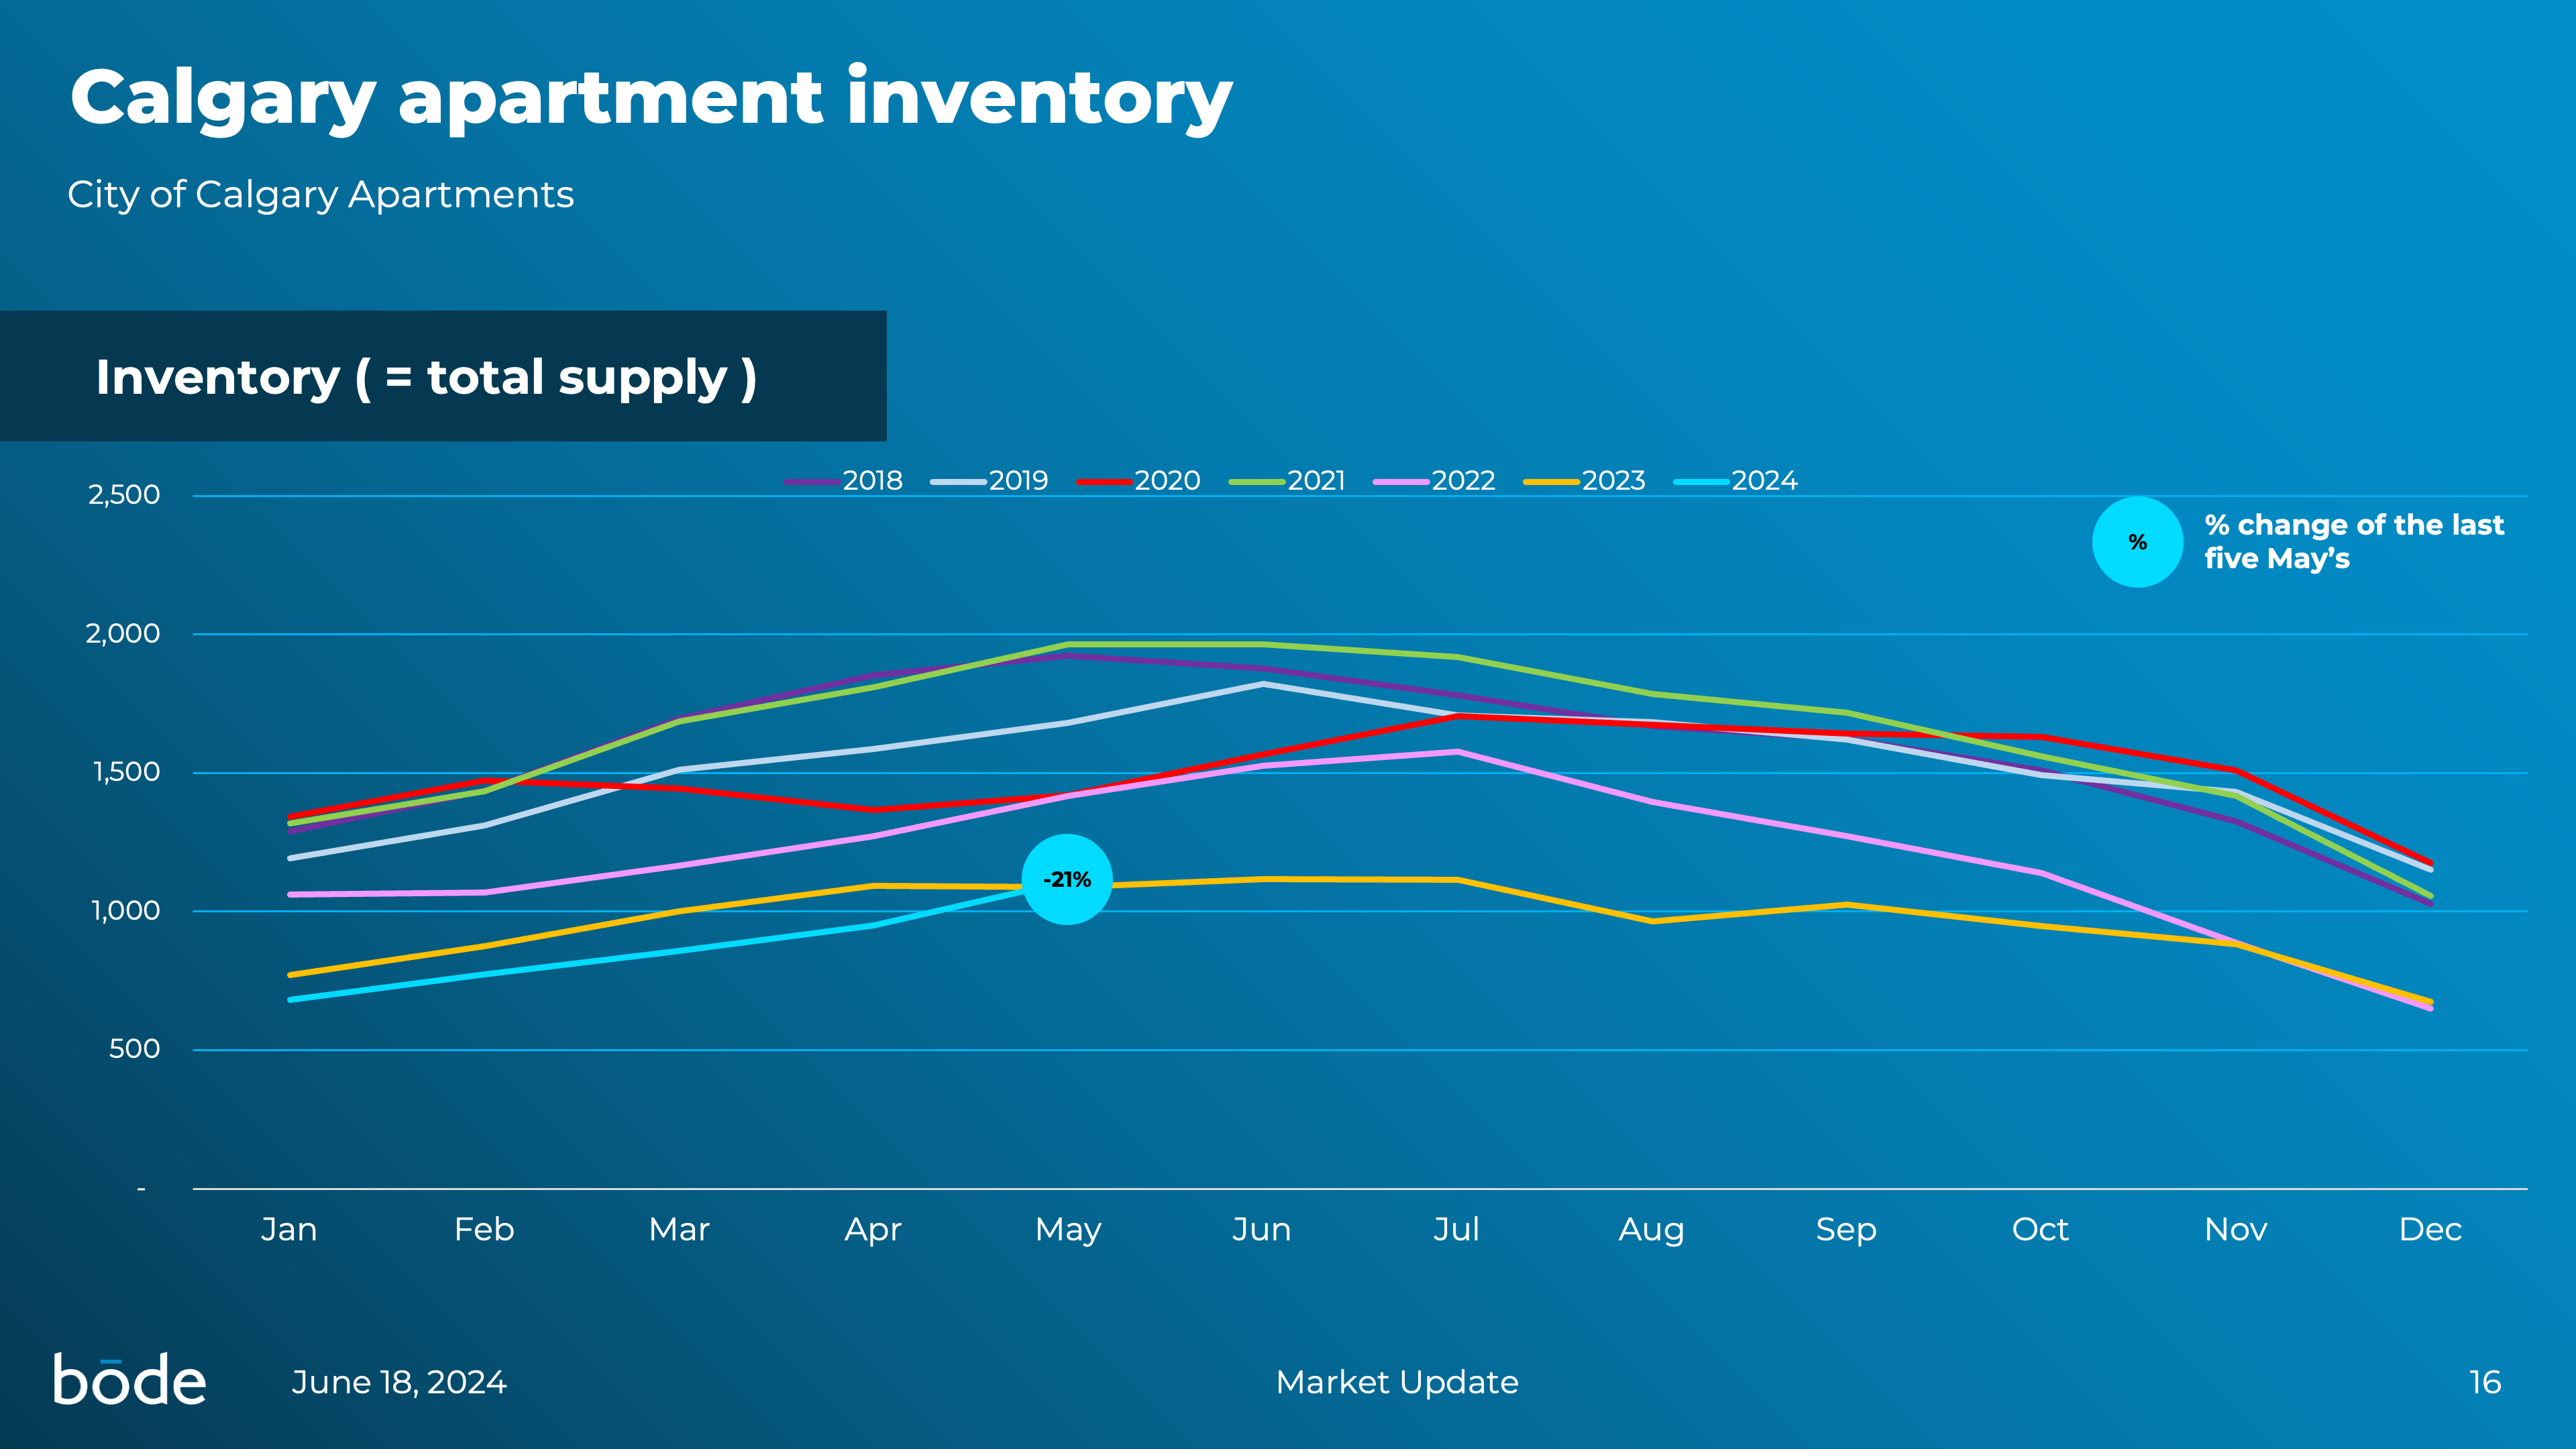
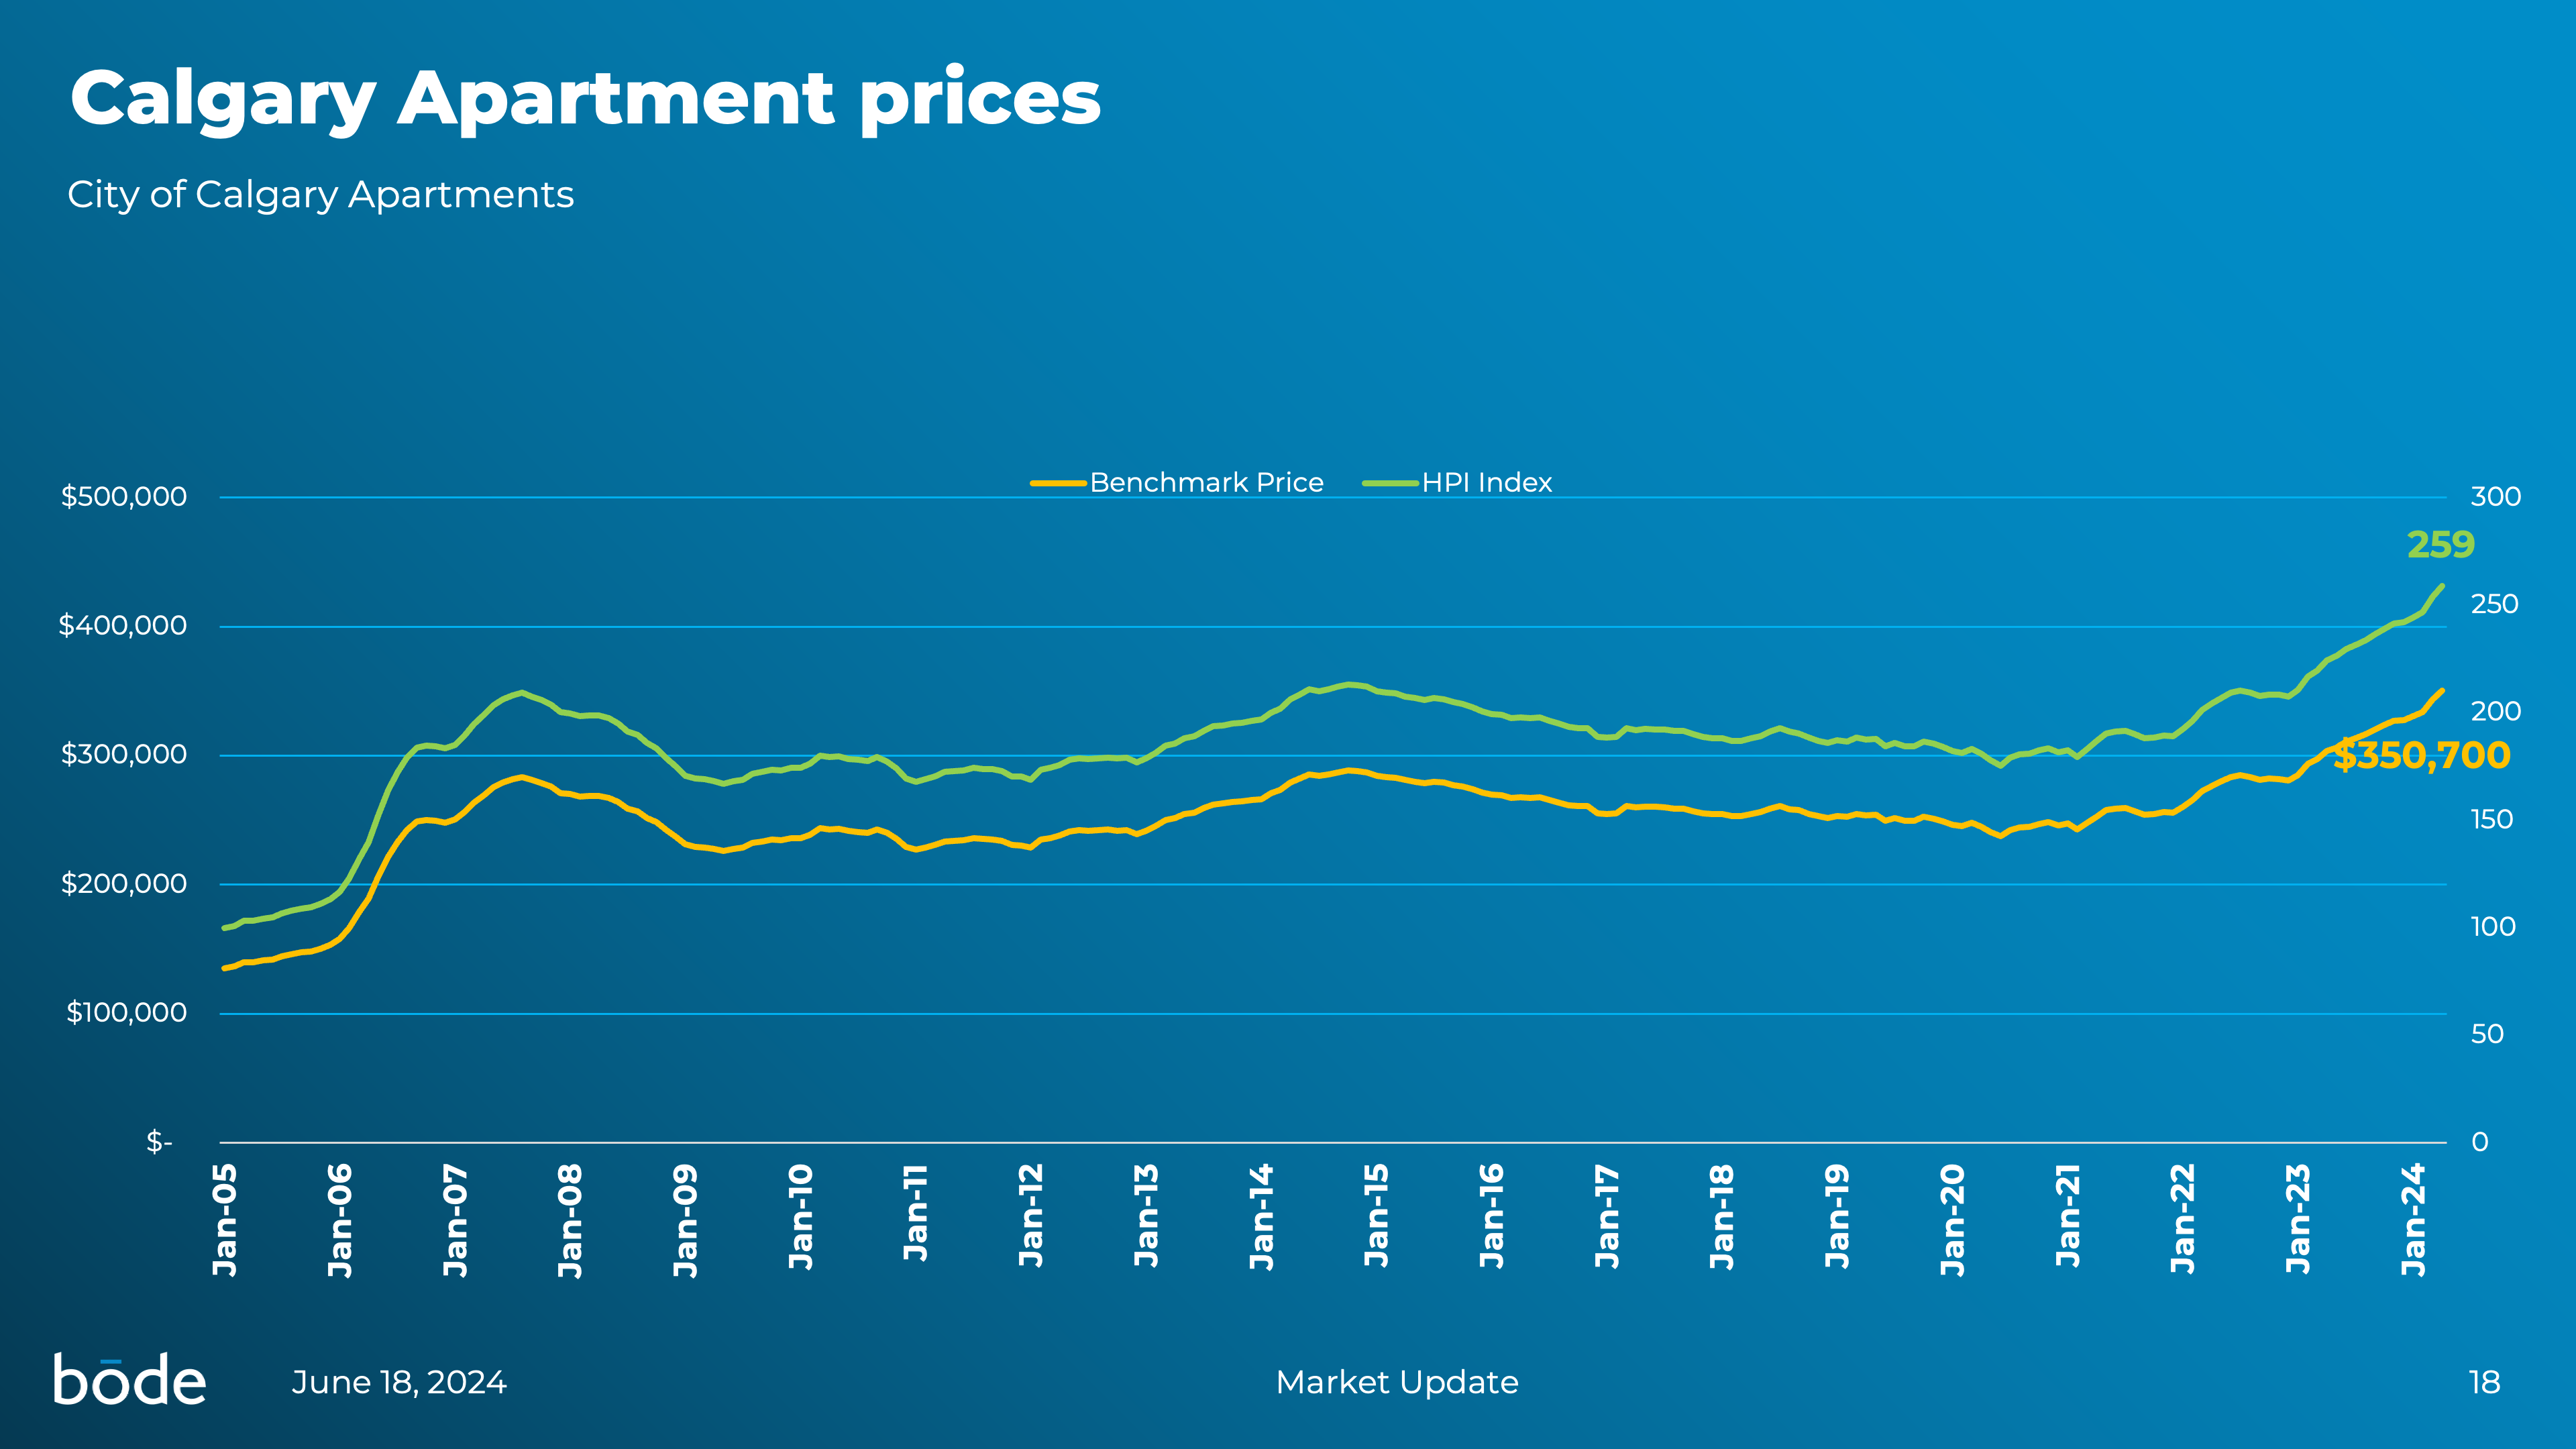
Calgary's Apartments
Looking at Calgary’s apartment market over the past five Mays, we see some remarkable trends. Listings have surged by 40%, suggesting a growing interest in putting apartments on the market. Sales have climbed even more dramatically, up 56%, indicating a strong and increasing demand. Despite this activity, inventory has shrunk by 21%, and the months of supply have plunged by 70%, making it clear that apartments are getting snapped up quickly. Meanwhile, prices have seen a steady rise, increasing 2% month over month and a notable 15% year over year. It’s an exciting time for Calgary’s apartment market, with vibrant activity and robust price growth.
Calgary's Attached Homes
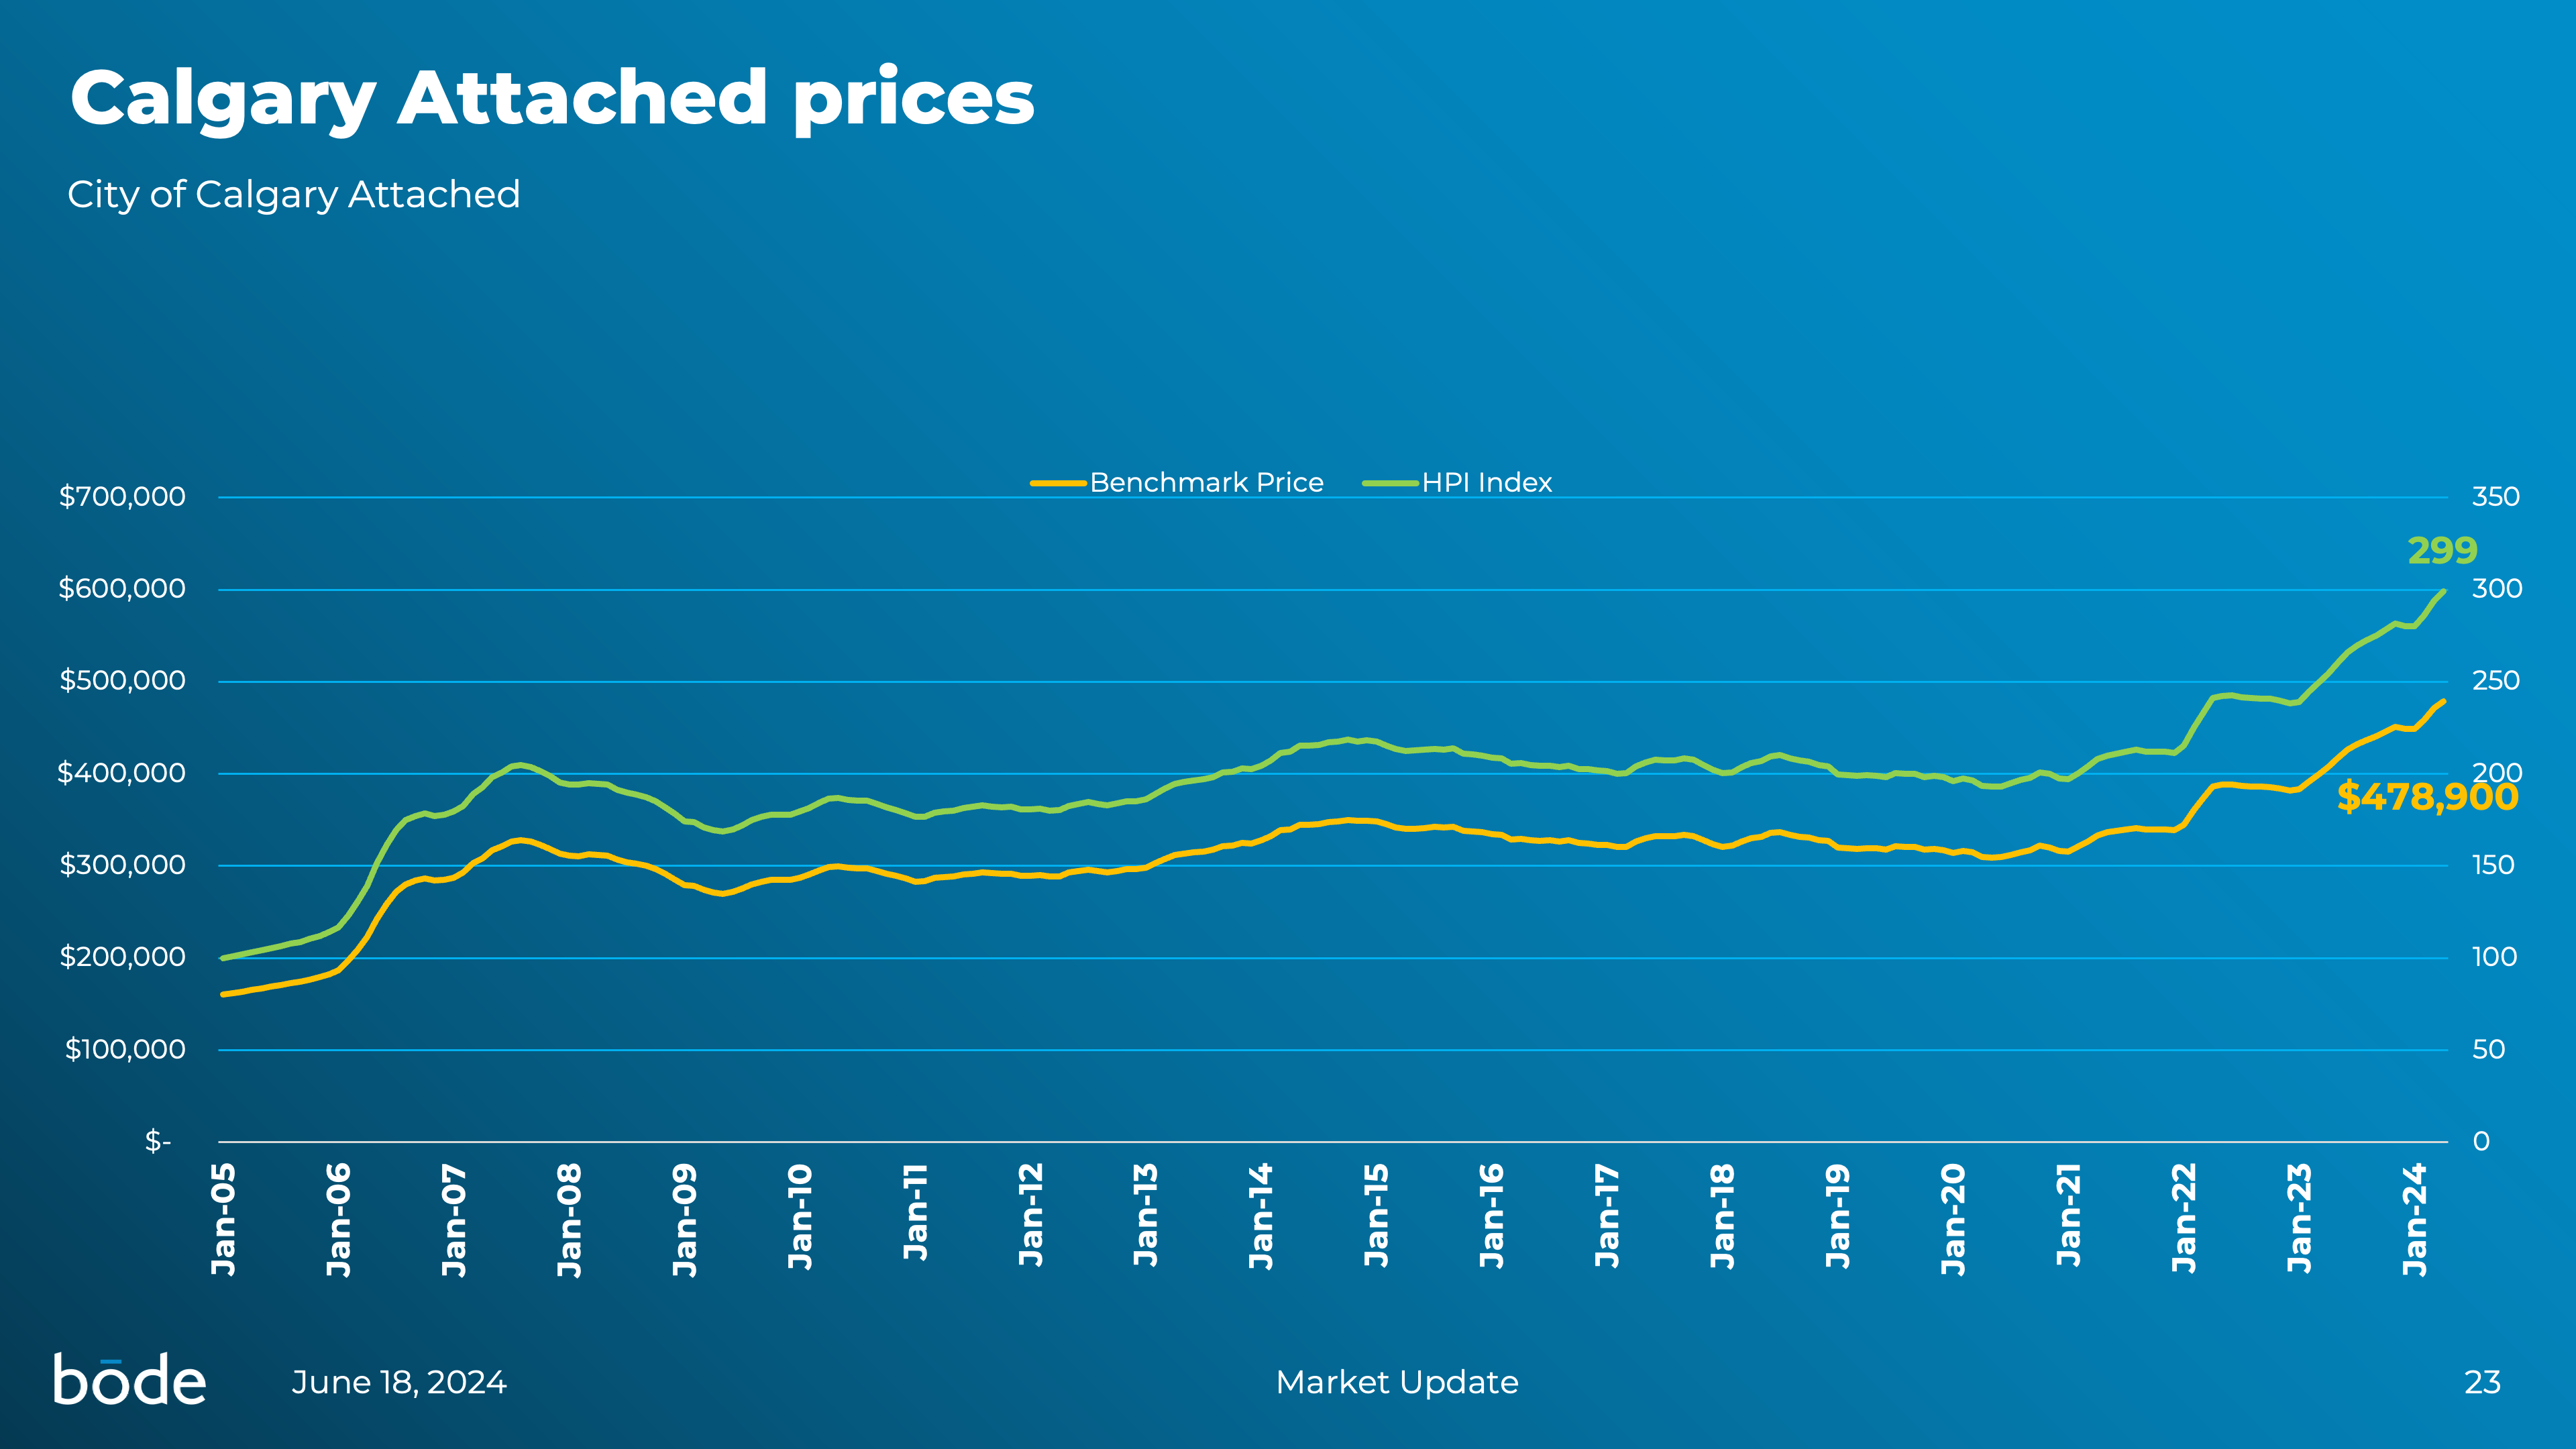
Examining the latest data, it’s exciting to see that listings have risen by 13% over the last five Mays, and sales have jumped by 19%, signaling a bustling market with plenty of activity. At the same time, inventory has tightened significantly, down 39%, and the months of supply have decreased by 43%, indicating that homes are selling faster than ever when we look over the last five Mays. Prices are also on the rise, with a 2% increase month over month and a substantial 18% hike year over year. These trends highlight a dynamic market where demand is high, and prices continue to appreciate.
It’s critical to understand the dynamics in your local property market
To understand your local property market you need to look at your local data. Head over to Bōde’s new and improved Market Data dashboard, the only place where you can see all the data yourself, including being able to filter on community, property type, and price range to see exactly what’s happening where you live.
You can also see the sold price of any home that has sold in the last 2 years using Bode’s Sold Data page.
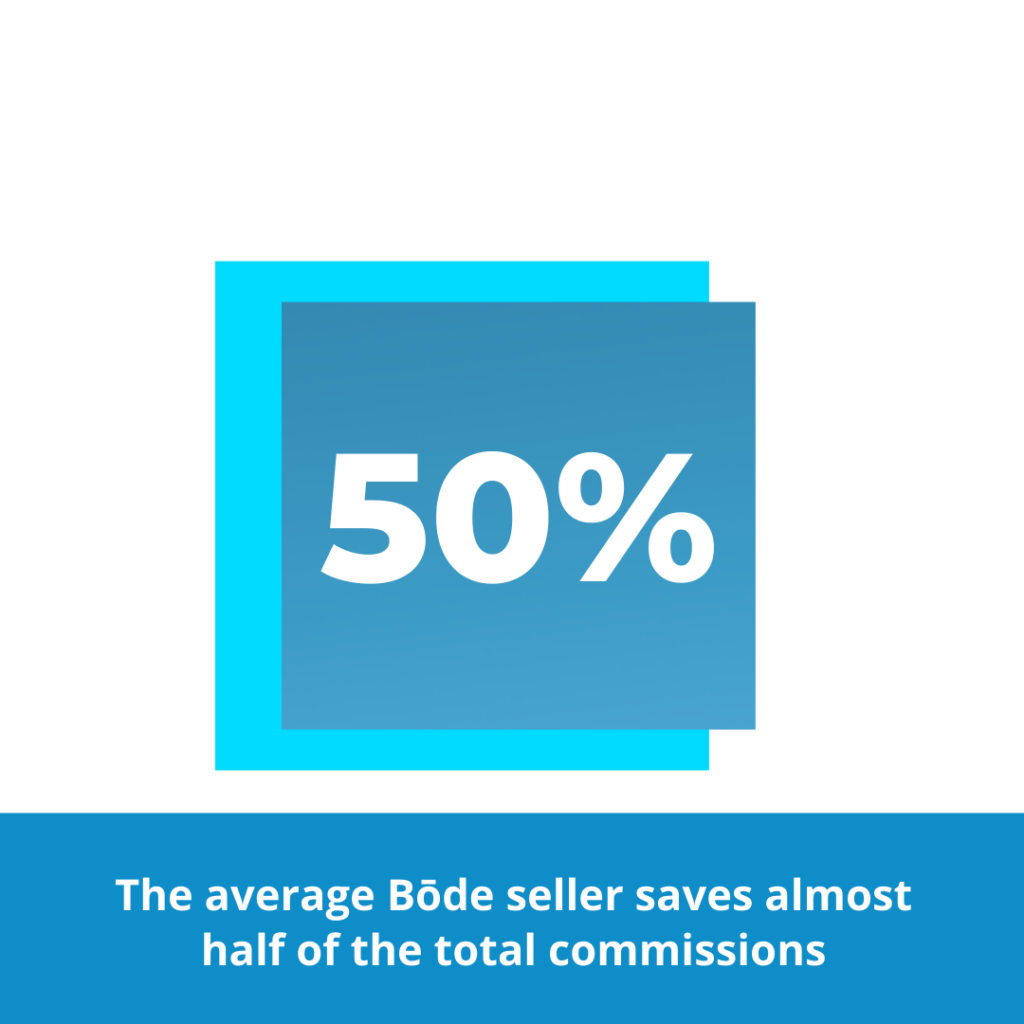
Bōde has created a marketplace to allow you to get transparent home data, set your price, and list your home on MLS (and 1000+ more sites). We will advertise your home and walk you through the whole sale process for 1% up to a maximum of $10K, only when the home sells.
Looking to buy? Bōde empowers buyers to purchase any Bōde property – for no charge.
With your free Bōde account, you don’t need an agent – you are completely in charge of your home sale or purchase and get to keep more of the money you invested in your home!
Saved nearly $15,000 by having my offer accepted through Bōde instead of through a real estate agent. If you are willing to be more involved in the process it's definitely worth checking out.
My house sold with Bōde for $30k higher than what most realtors estimated, while saving me a ton in fees.
As a builder, I pour my heart and soul into these projects. With Bōde I was able to sell four luxury homes in 21 days, saving well over $100,000 in commissions.
We saved thousands of dollars selling out home with Bōde.
If we ever sell another home we will definitely use Bōde again.
We were amazed at how fast we were able to sell our home using Bōde.
We certainly priced our hom eright and were able to sell it for 7% more than market and 92 days faster!
Used Bōde to sell my condo, they were super responsive and helpful through the entire thing.
Scheduling all the showings myself was great, really simplified the process and saved a lot of money.
I have always wanted to list, show and sell my own homes in the pas but without a real estate licence it was never possible.
Now with Bōde, marketing and selling your own home is in reach.