Written by Alan Kelly, Bōde’s Chief Economists
In August, Vancouver real estate prices and sales continued on their slight downward trend compared to earlier in the year. But it’s actually still a great time for those thinking of selling! Inventory remains very low – meaning home sellers have less competition and more opportunity to sell their homes. Data also shows that prices are still significantly higher compared to this time last year.
When you are thinking of buying or selling your home in Vancouver, it is important to understand what is happening in the housing market. Obviously, there are many important factors to consider (what kind of home you have, what community etc.), so it’s important to look specifically at what the market is doing in your local area.
Bōde makes buying and selling your home a streamlined process offering significant time and cost savings along the way.
We are also here to make sure you have the information you need to make the decisions that are right for YOU!
What’s happening in the Vancouver real estate market as of September 2022?
Let’s start with a Macroeconomics view
To understand what’s happening in the real estate market you have to look at supply and demand.
The best proxies for supply and demand are:
Supply
- New supply: New Listings (i.e. the number of homes recently listed for sale)
- Total supply: Inventory (i.e. the total number of homes listed for sale)
Demand
- Sales (i.e. the number of homes recently sold)
Supply & Demand
- Months of Supply (i.e. the number of months it would take to sell all current inventory at the current rate of sale)
These metrics are the best indicators of the health of the real estate market. Let’s look at what they show us.
Vancouver sales drop below historical levels for first time in 2 years
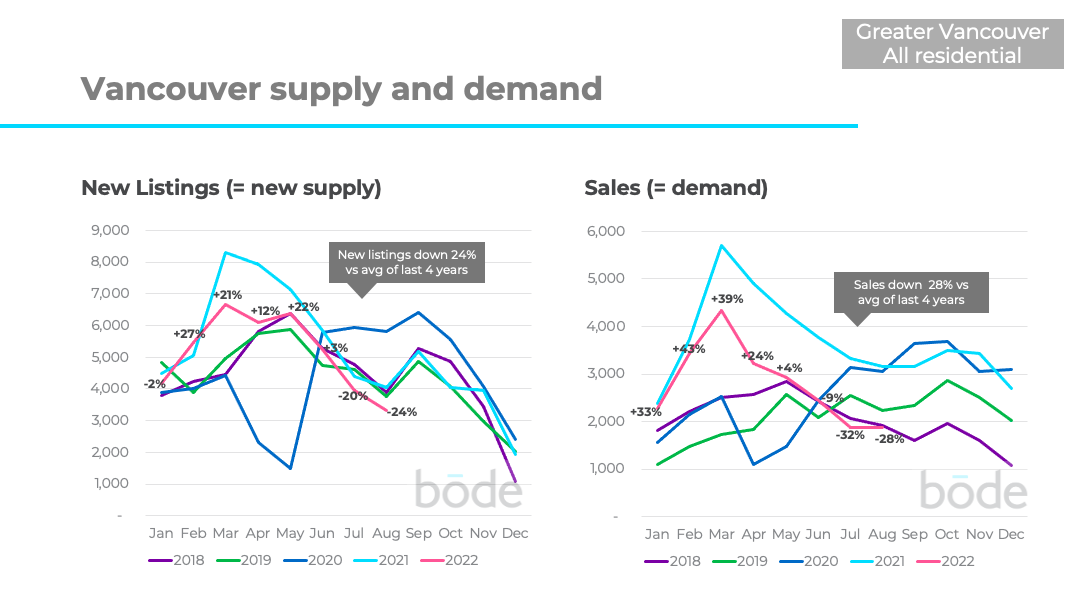
New listings in August were down 24% while sales were down 28% vs. the average of the previous 4 years.
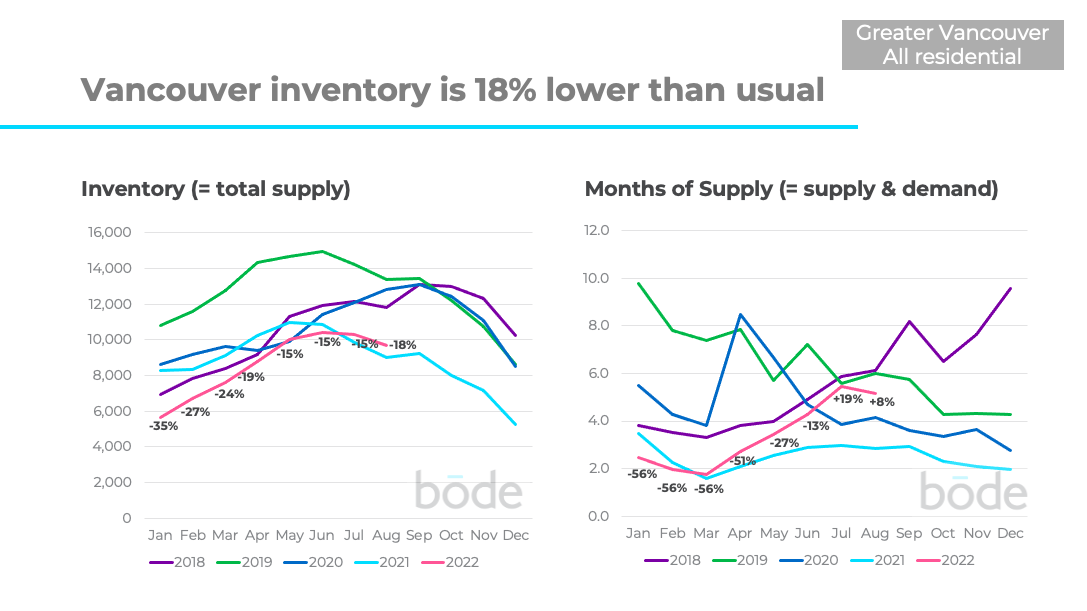
The total number of homes for sale dropped. Inventory is down 18% vs the average of the last 4 years.
‘Months of supply’ has increased quickly in recent months. There are now more than 5 months of supply which is +8% vs the previous 4 years.
Less inventory & fewer months of supply makes conditions more favourable for sellers, while more inventory and higher months of supply is more favourable for buyers.
The sudden slow down in sales and hence increase in months of supply mean it’s now a more balanced market and no longer a strong sellers market.
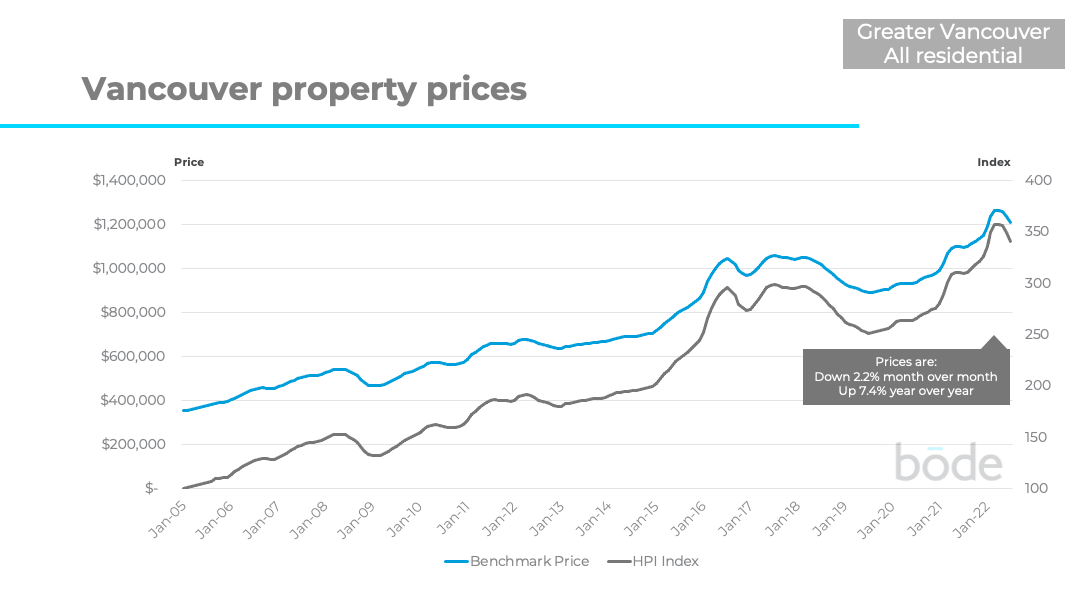
Vancouver prices had been increasing quickly since the start of 2021, ending a relatively flat period between mid 2018 and the end of 2020. However prices are now declining. They are down 2.2% over last month, while still being up 7.4% over last year.
What does this mean for sellers?
Right now the balance of power is shifting from sellers to buyers. However, sellers who price their home well will be able to sell. Your specific property value will be determined by market forces both within your community and against similar active listings. To find out what supply and demand look like for your specific community, click here.
What does this mean for buyers?
There are currently fewer homes for sale than there have been in previous years. However the frenzy to view homes quickly and make a fast offer has begun to slow.
Market conditions vary substantially by property type, community and price range
Above, we’ve looked at the overall market for Vancouver, but different segments are performing very differently. Let’s look at a few examples.
Sales for detached homes were down 38% in August vs. previous years, while new listings were down 22%
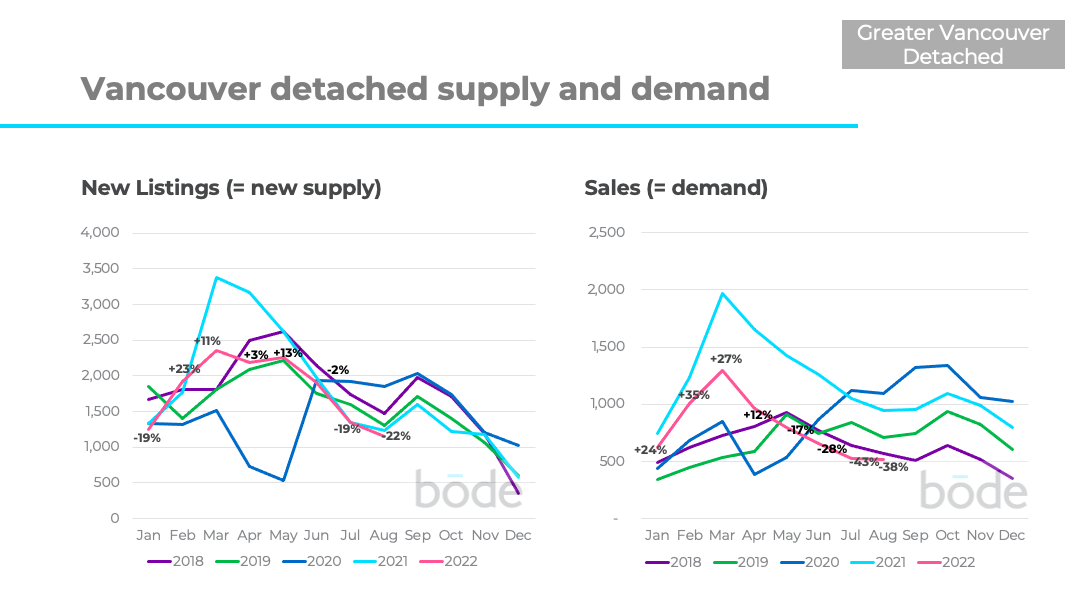
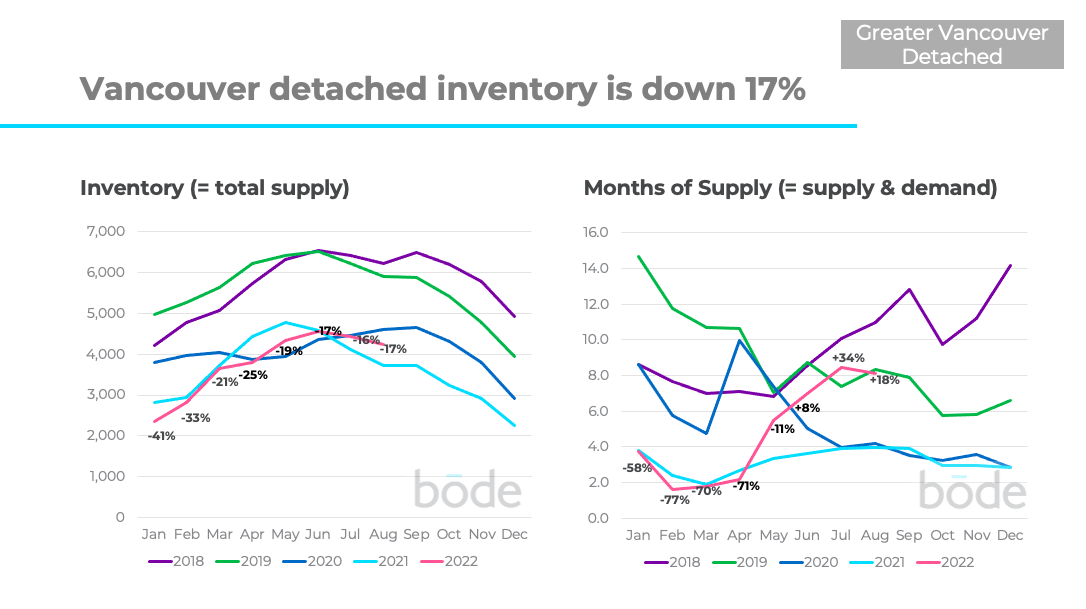
The overall number of detached homes for sale is down 17% vs the average of the last 4 years.
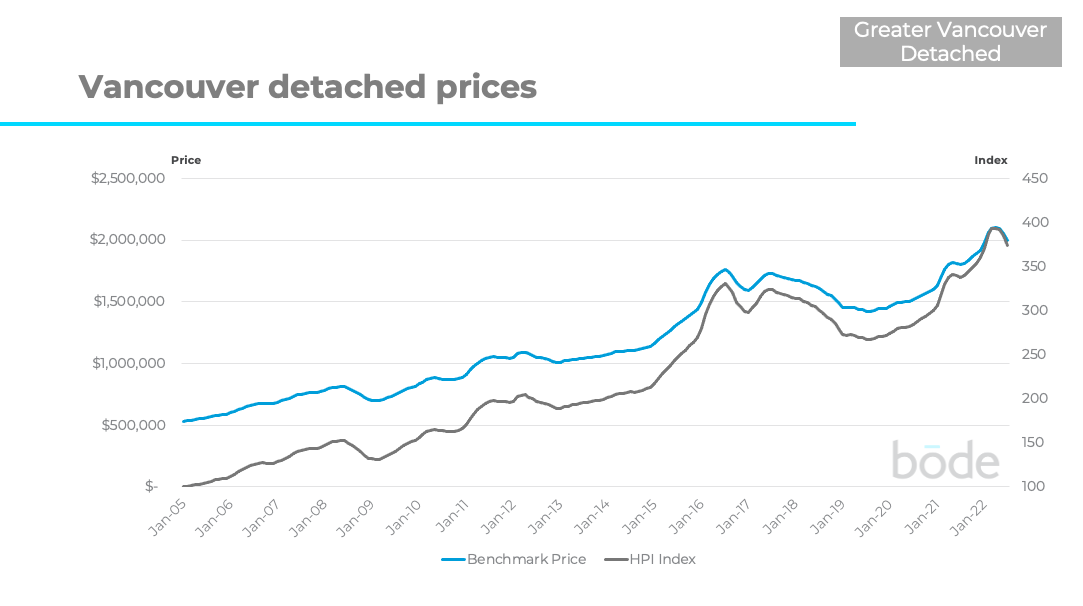
Detached prices had been increasing quickly for much of the past 2.5 years, but have declined in recent months.
Apartments:
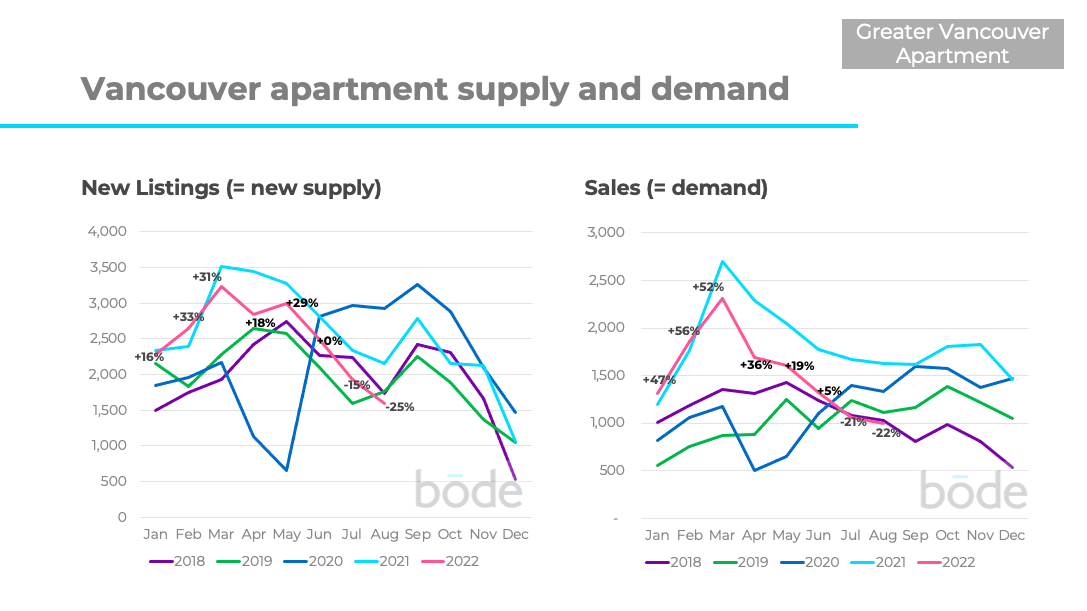
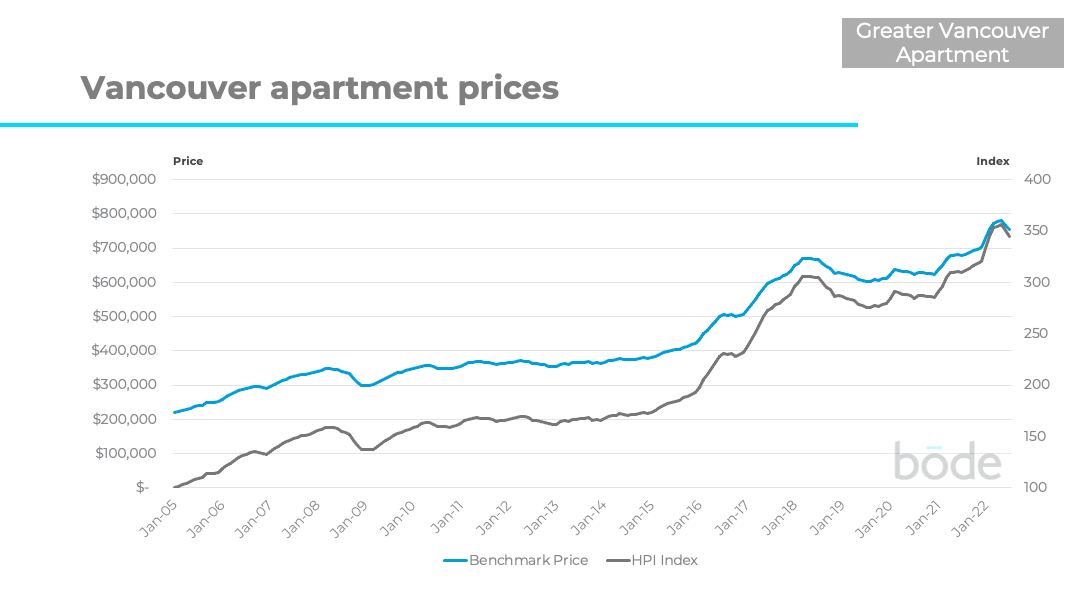
New listings of apartments were down 25% in August compared the average of the previous 4 years, while sales were down 22%.
The overall number of apartments for sale is down 17% vs the average of the last 4 years.
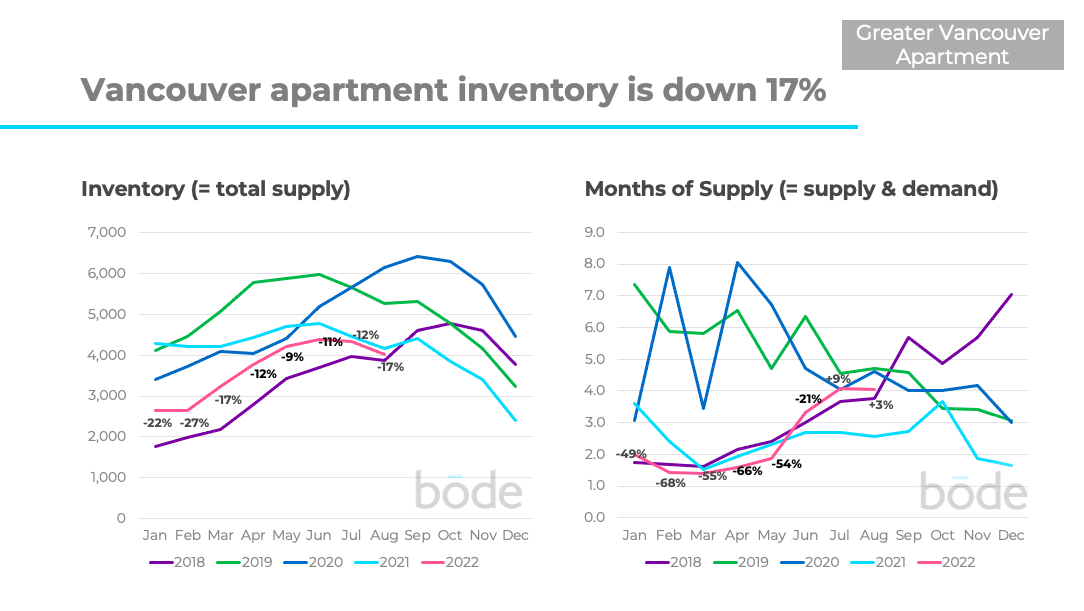
Apartment prices have generally been increasing for most of the past year but have started to decline in recent months. Prices are down 2% from last month, while still being up 8.7% from this time last year.
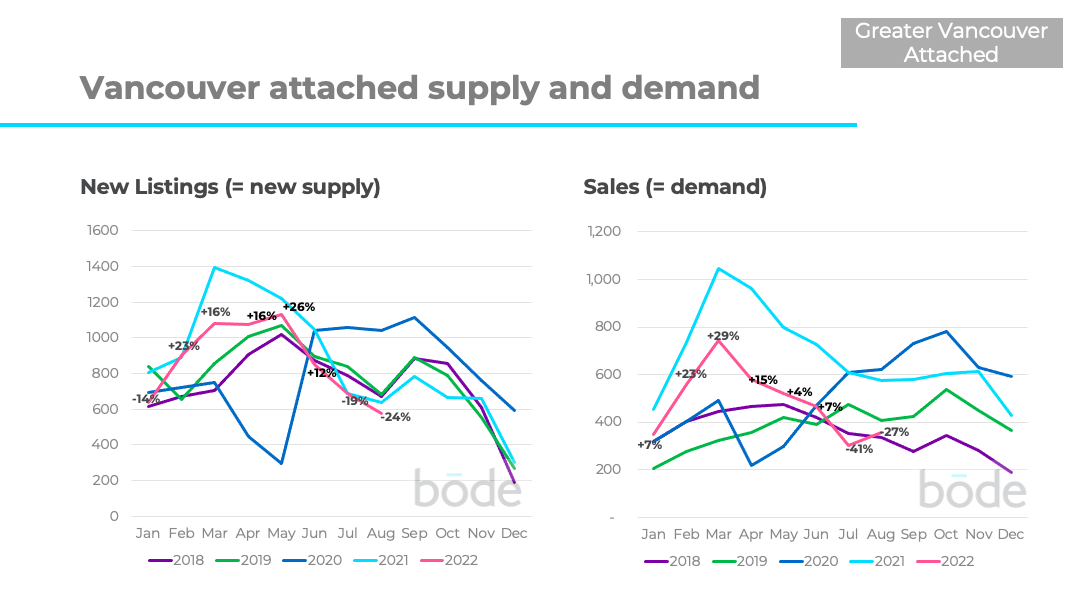
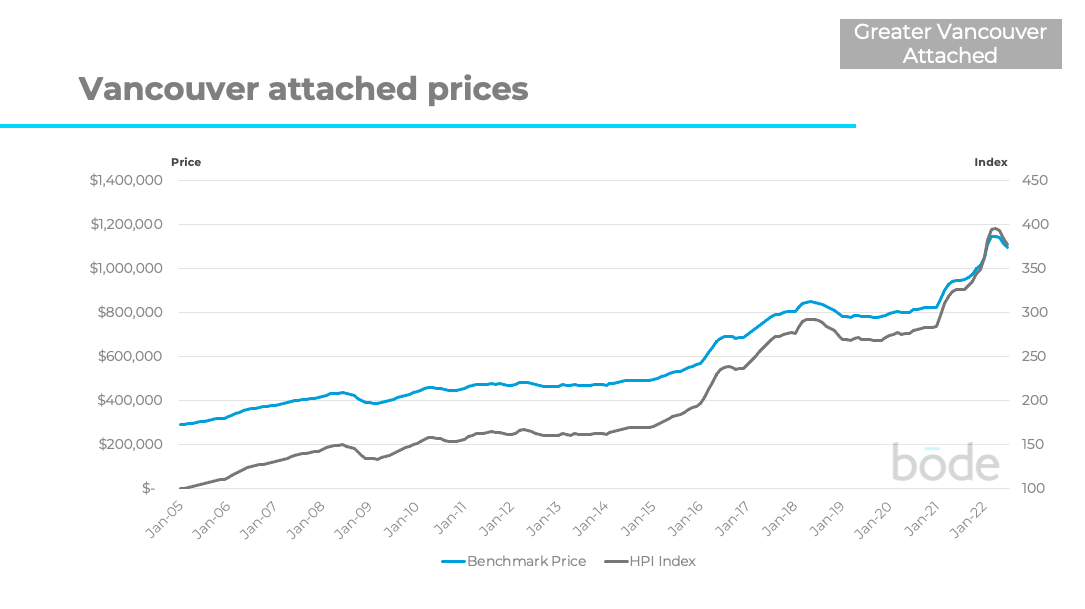
New listings of attached homes were down 24% while sales were down 27% in August (compared to previous years).
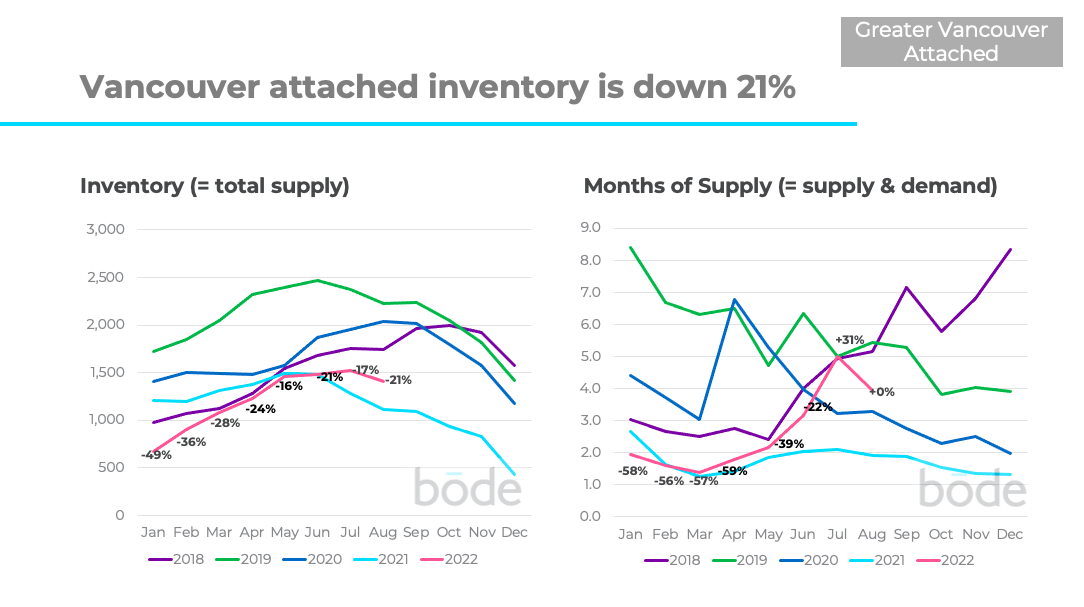
The overall number of attached homes for sale is down 21% vs the average of the last 4 years.
Prices for attached homes have been increasing quickly for the past year but have recently started declining. Prices are down 2.5% from last month, while being up 12.7% vs. this time last year
However, what really matters is what’s happening in your specific local property market. There are some communities and price bands where homes are performing better/worse.
It’s critical to understand the dynamics in your local property market
To understand your local property market you need to look at your local data. Head over to Bōde’s new and improved Market Data dashboard, the only place where you can see all the data yourself, including being able to filter on community, property type, and price range to see exactly what’s happening where you live.
You can also see the sold price of any home that has sold in the last 3 years using Bode’s Sold Data page.
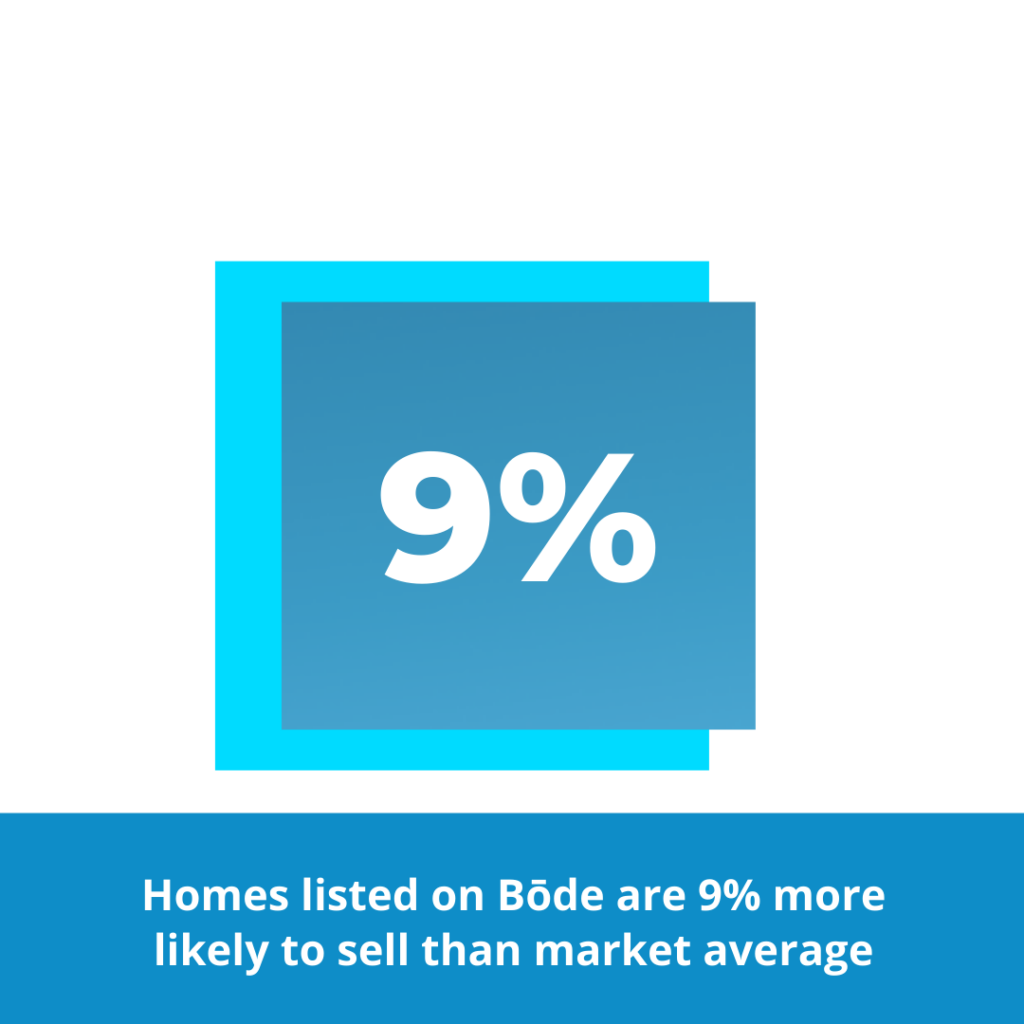
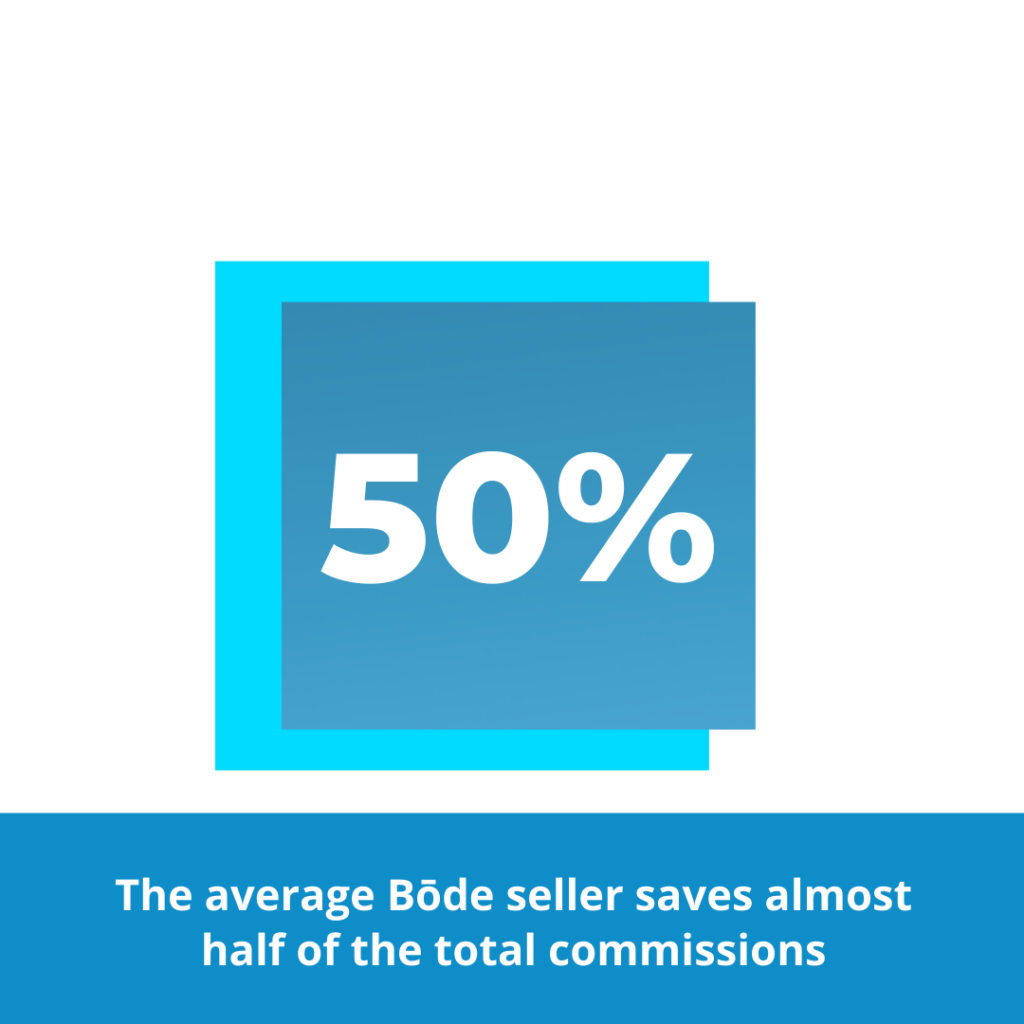
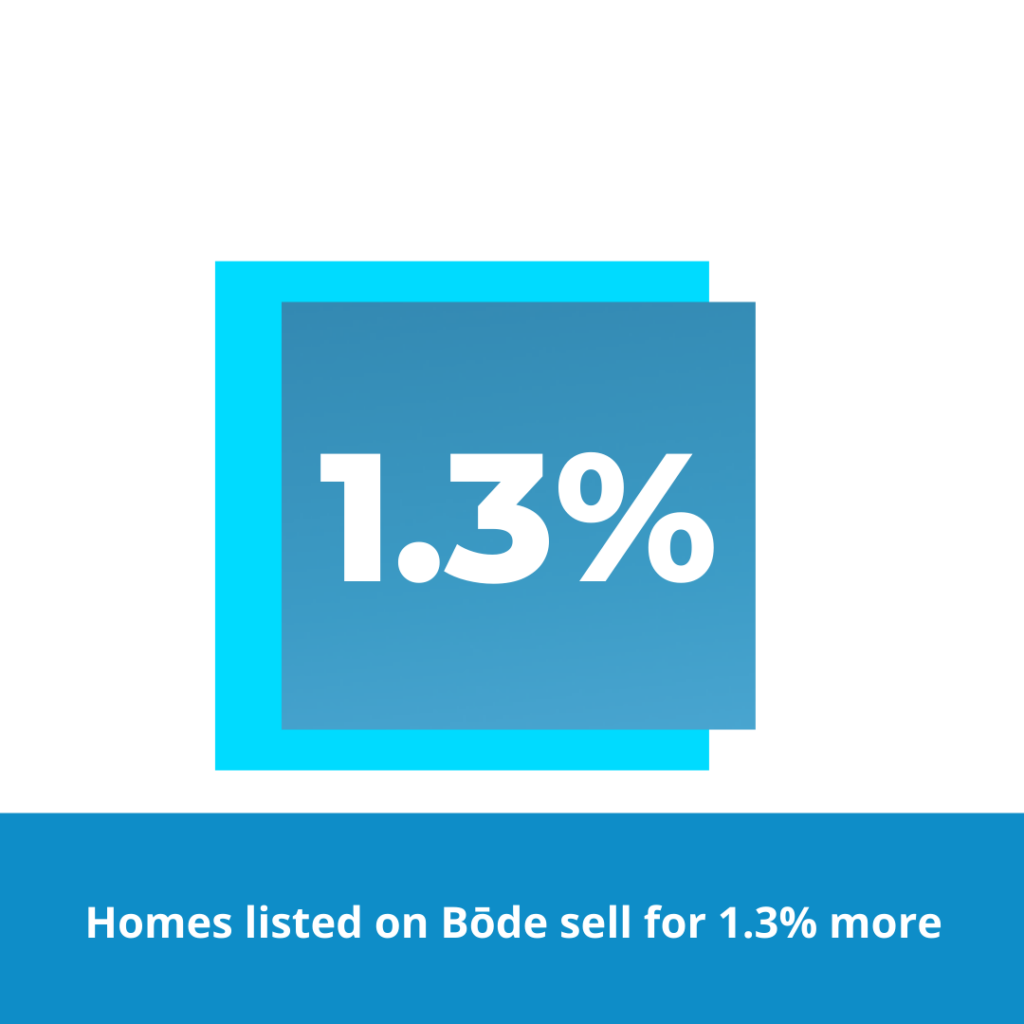
If you’re thinking about selling, take a look at how Bōde helps sellers sell for 1.3% higher prices while paying 50% less commission.
Want to Buy or Sell Your Home Without an Agent?
Welcome to Bōde
Bōde has created a marketplace to allow you to get transparent home data, set your price, and list your home on MLS (and 1000+ more sites). We will advertise your home and walk you through the whole sale process for 1% up to a maximum of $10K, only when the home sells.
Looking to buy? Bōde allows users to purchase any home listed on MLS – at completely no charge.
With your free Bōde account, you don’t need an agent – you are completely in charge of your home sale or purchase and get to keep more of the money you invested in your home!
Get started at bode.ca


